It is still not simple, as it covers many aspects, but the format is a basic list that anyone can complete fairly easily. You can decide whether to rate each criterion (light-grey rows) which will automatically calculate a score per category (dark-grey rows). Or you can directly enter a rating for the overall categories (blue-green rows).
When Osterwalder and Pigneur (2010) presented their business model canvas, it quickly popularised the idea of holistically visualising interconnected parts of complex topics on a single page. The one-page overview has proven to be useful for both workshops in design and planning phases as also for communication during execution.
The approach was soon emulated in project management. One of the more recent, and well explained, project canvases is from Antonio Nieto-Rodriguez (2019) and the author has been kind enough to post the chapter on his canvas here.
Below I propose my own project canvas which you can also download here. Why a new version? Mainly to have something that reflects my own thinking for my own use. But I also see a strength in this version: It takes an end-to-end view of the project management lifecycle all the way up to benefits realisation. A failure factor I have observed many times, is to celebrate success when the project deliverables have been produced and to neglect the implementation of those deliverables in operations. A recent case was the successful go-live of a new CRM system after 18 months of project work. Six months after go-live, management checked the dashboard and only 5% of users were using the new system. A follow-up project was launched to improve adoption. This work could, and should, have been planned from the outset. Deliverables do not automatically produce benefits. This aspect is also addressed in the 10 Minute Project Health Check.
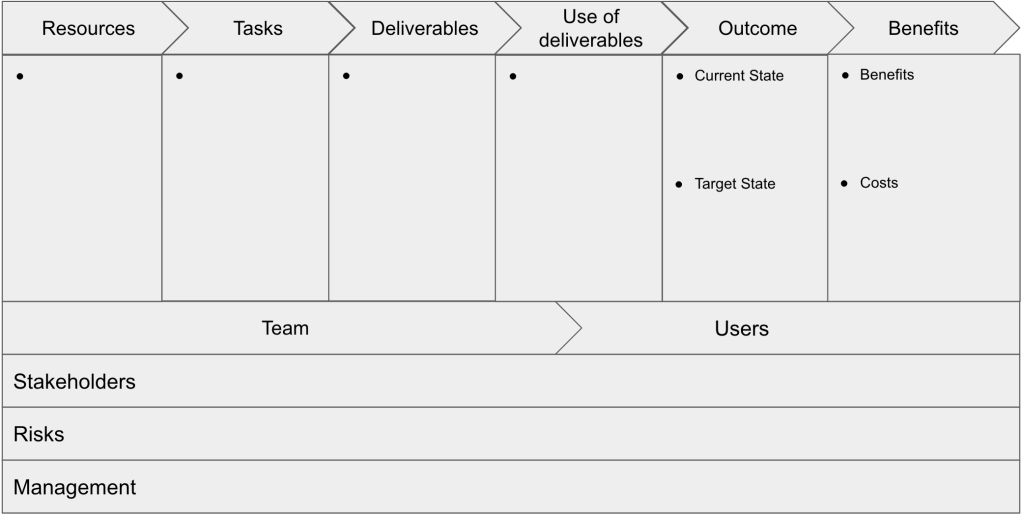
So what does the canvas look like? Here it is:
This canvas takes an input – transformation – output view of the project (i.e. resources are the input which are transformed by tasks into deliverables as output). The next elements of the canvas address the use of those deliverables in operations to produce an outcome. That outcome should reap a benefit for the project to be successful.
Initially the project team is more involved in the project, but as the deliverables are handed over to users, their time becomes more relevant.
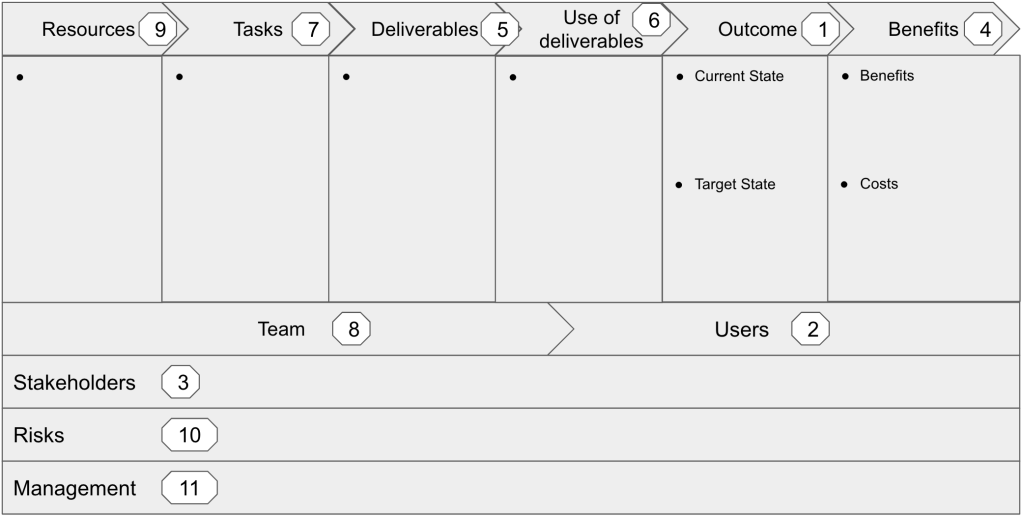
We can also summarise the canvas at a level higher as the ‘How’, ‘What’, ‘Why’ and ‘Who’ of a project:
The flow of the arrows at the top reflect a basic chronology of the project (though this will be iterative, especially if the project is run following an agile approach). But if you use the canvas in the design phase of a project, it will not make sense to follow the canvas from left to right. There is no single right sequence to go through each section of the canvas, but the following is a good option to get started:
Of course, this will be an iterative process, for example, you may revise the current state (step 1) after talking to stakeholders (step 3) and you can only know the costs (step 4) after specifying the resources (step 9).
And of course, a canvas cannot contain all information on the project and you still need to apply the usual project management methods as you do otherwise. So whilst in the background you will have a complete risk register, the canvas may show an aggregated score per risk category and highlight the main risks that are currently being managed.
The following gives a few ideas of what could be included in each part of the canvas. This is listed in the sequence of the steps noted above:
Canvas element
Content
Outcome
What is the current state regarding process, organisation and systems as related to the intended scope of the project? What are major issues and to which degree are you reaching goals and objectives? What is the target state related to the above points that you wish to achieve?
Users
Who are the users within the scope of the outcome and what are their key needs and interests? What is their input to the current and target states?
Stakeholders
A stakeholder analysis. What is their input to the current and target states?
Benefits
What are the benefits and costs of changing from the current to the target state? If possible this should be translated into financial figures. If this is an ‘enabling’ project that provides prerequisites for other projects to build on, then there should be a program that contains these projects and the business case must be valid for the program.
Deliverables
Which products, services, learning and information does the project need to provide to the users so that they can reach the target state? In an agile project this will be the backlog. In a classical project it could be a separate definition of deliverables or you could use the work-breakdown structure. The deliverables describe the scope of the project. You can also add an out-of-scope section if this helps clarify the scope more clearly (but there is a risk here, that if you forget to exclude something, the customer can argue it must be in scope).
Use of deliverables
How will the project deliverables be used in operations to achieve the intended outcome, i.e. the target state? How will the adoption be secured?
Tasks
What work needs to be done to produce the project deliverables and ensure their effective usage in operations?
Team
Which people will be freed up from other work to complete the project tasks?
Resources
Which other tangible (software, equipment, infrastructure etc.) and intangible (expertise, culture etc.) will you need to do complete the project tasks?
Risks
A risk analysis. You can use all of the other elements of the canvas to categories your risks (e.g. stakeholder risks, resource risks etc.)
Management
Who is the project manager and what are her or his qualifications? Who is the sponsor and the steering committee? What kind of corporate governance is in place? Which project methodology will you apply? Will the project be run waterfall, agile, other or hybrid?
Elements and content of the project management canvas
Behind each element of the canvas, there will be a separate artefact such as a risk register, a stakeholder analysis or a work-breakdown-structure. But the canvas can help you, your team and other stakeholders maintain a big-picture whilst you work through the details, to make sure everything fits together as a cohesive whole.
So those are a few thoughts and hopefully, something there is something of use for your own project management practice!
References
Rodriguez, Antonio Nieto: The Project Revolution: How to Succeed in a Project Driven World, LID Publishing, 2019
Osterwalder, Alexander and Pigneur, Yves: Business Model Generation: A Handbook for Visionaries, Game Changers, and Challengers, Wiley & Sons, Hoboken 2010
There is a multitude of literature on project success factors but most methods to check project maturity are pretty heavyweight and time-consuming. They are more geared toward improving the overall project management competence in an organisation as a whole rather than assessing an individual project.
A simple way to assess the project management quality of a single project would be to check if the project management methodology of the organisation was adhered to. This is a good step, but can lead to the methodology being applied in a clinical fashion to check the boxes.
Project success builds on a system of people, objectives, work, deliverables, and on the effective use of those deliverables in operations. None of these elements stands alone – they must constitute a cohesive whole. And project success does not conclude with the acceptance of agreed deliverables, but with the benefits realised by using those deliverables in operations. The below checklist is an attempt to assess an individual project against this systemic and end-to-end view. The list is not complete, but focuses on the ‘must haves’. As such, even a few boxes that cannot be checked as true, are likely to break the project.
SUCCESS FACTOR
TRUE
FALSE (OR NOT SURE)
PROJECT CONCEPTION PHASE
The problem you want to solve with the project, i.e. the current state,is clearly specified in regard to organisation, process, systems and other relevant factors
The target state you want to achieve is clearly specified and is the best option to solve the problem
The benefit of the target state has been specified and made measurable
The deliverables (i.e. the goods and services that the project will deliver to achieve the target state) are clearly specified
Acceptance criteria for the project deliverables have been agreed with the users of the deliverables and with the project sponsor
The work required to ensure the adoption of project deliverables by users in operations in order to realise the target state is an integral part of the project
Project risks have been assessed and planned for
PROJECT INITIATION PHASE
There is a business case, i.e. the benefits of making the change is larger than the cost of producing and using the project deliverables
An executive sponsor with sufficient influence, command over resources and competences is convinced by the business case and is motivated to drive the change from initiation to benefits realisation
A project manager with the right knowledge and skill set has been freed up for the project and given sufficient authority
There is a proven project management methodology in place and the project team has sufficient knowledge and skills to apply this methodology effectively
PROJECT PLANNING PHASE
The work required to produce the project deliverables has been identified and broken down into mutually exclusive but comprehensive parts (work packages or sprints)
The work effort required to produce the deliverables has been realistically estimated (duration or story points)
The people required to do the work to produce the deliverables are qualified and motivated and have been freed up from their other tasks
The people required to do the work to produce the deliverables have agreed to SMART objectives
PROJECT EXECUTION PHASE
All project team members know by when they should complete which tasks
Project team members are motivated and capable of completing their tasks
PROJECT MONITORING AND CONTROL
Risks are regularly monitored and managed
Feedback from project team members on project progress, concerns, issues and risks is continuously gathered, assessed and managed
Regular status reports on production of deliverables against plan and on risks are made to the project sponsor in a standard format
PROJECT HANDOVER AND OPERATIONS
The project sponsor has approved the project deliverables based on the defined acceptance criteria
The users have approved the project deliverables based on the defined acceptance criteria
Users use the project deliverables effectively in daily operations according to the defined target state
BENEFITS REALISATION
The realisation of the intended benefits has been verified by the project sponsor
If the intended benefits have not been realised, corrective action has been defined, planned and implemented
BPM can go far beyond modelling, standardising and improving processes. A holistic approach to BPM puts the process at the centre of how we connect strategy, people, systems, compliance, quality and more. With this kind of understanding, BPM can prove itself as a management approach to align and act on strategy. This post compiles some key principles that are foundational to such an understanding. This is not a complete picture, but will hopefully provide some useful ideas on how to expand the application of BPM. Some principles are rudimentary, others cover a lot of ground, some of these will be the topic of future posts.
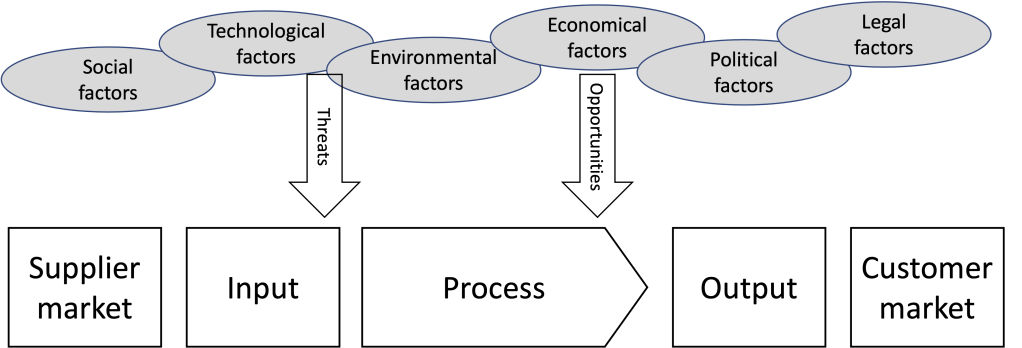
A process transforms input into value-adding output
A process transforms input from a supplier into output that will be used by the customer. This is reflected in the acronym widely known in six-sigma: ‘SIPOC’. The output produced by one organisation becomes the input of the next organisation.
Input could be raw materials, personnel, tools and materials, information etc. Outputs are the products, services and information that are used by the customer as raw materials and so on.
The cost and effort going into processing inputs is only worthwhile if the value that has been added from input to output is something the customer is willing to pay for – plus a margin.
Processes drive operational and strategic performance
The value a process adds to the input when producing the output is the value of that output to the customer and this can be called as the effectiveness of the process. This is primarily about doing the right thing, i.e. delivering the optimal output to the customer with the right specifications, service-level, price etc.
Effectiveness is one of 4 ‘Es’: Economy, Efficiency, Effectivenes and ESG.
Economy is the cost at which I can procure the inputs – the lower the better as long as I can still be effective
Efficiency is ratio output / input, i.e. how much output can produce with how little output – this is about doing things right, how well we work
Effectiveness is the value of the output to the customer – the focus is on doing the right thing
ESG covers sustainability and ethical aspects of the process in the dimensions environment, social aspects and governance
Using a balanced scorecard, process performance can be mapped to customer and financial performance to visualise the impact of processes on strategic goals and objectives. A simpler but useful approach is to simply visualise on the organisations process map which process drives which goals and objectives.
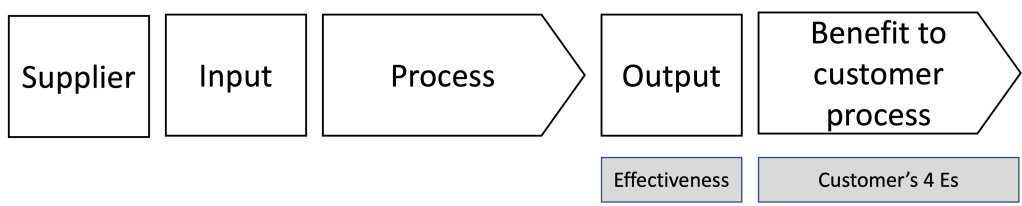
The value of the process output is the degree to which it benefits the performance of the customer process
We have already defined the effectiveness of a process as the value of the output to the customer. Here we take a closer look at the value to the customer. The value of an output to the customer is the degree to which the output serves to improve the customer’s process performance (i.e. the customer’s 4 Es).
If a tool is longer-lasting it will improve the efficiency of the process. If a surface treatment a company provides is harder wearing, this will improve the effectiveness. A useful way of thinking here is in term of output, outcome and benefit. The output may be a laser tool to cut steel plates. The outcome is that the customer buying the laser tool can cut steel plates in shapes with much finer detail with less errors. The benefit is that the customer can provide new and better products to its own customer with less waste (therefore improving both effectiveness and efficiency).
If the performance improvement enabled by an output is difficult to imitate or substitute, this becomes a distinctive competence that gives the organisation a strong position towards the customer and can leveraged as a competitive advantage.
Processes drive the economy by providing value adding output across the value chain
As organisations across the value chain process inputs to deliver value adding outputs, the cumulative value increases. Within national boundaries this overall output can be measured as GDP.
Processes run in the context of the external environment that poses threats and opportunities
STEEPL is an acronym that represents a framework to analyse the far external environment. The letters relate to social, technological, environmental, economical, political and legal factors that influence how an organisation can operate, i.e. how its processes can run. These factors may represent threats (e.g. stronger data protection laws, make it more difficult to run digital marketing campaigns) or opportunities (e.g. digital technologies make it possible to provide services globally). Influences from the far environment are generally difficult and slow to change (without strong lobbying) and processes must be adapted to comply with these constraints.
The supplier market and the customer market indicated left and right of the diagram above, but also the job market, represent the near external environment with which the organisation needs to interact. A useful analysis tool for initial high-level insights is Porter’s five forces.
The opportunities and threats from the near and far external environments are the first two quadrants of a SWOT analysis.
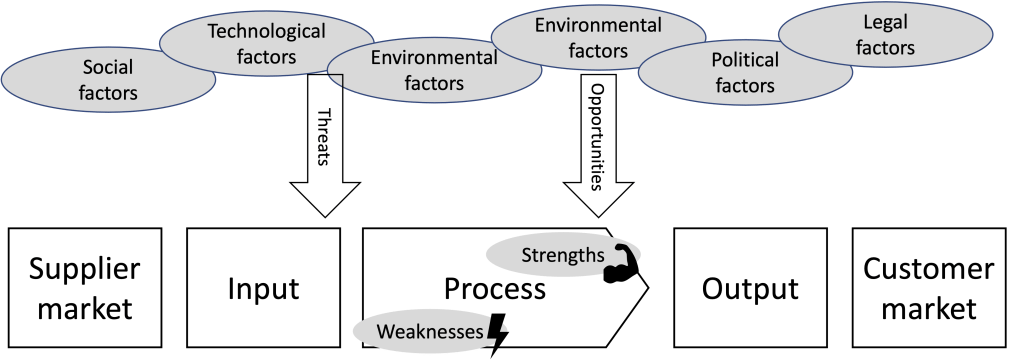
Processes manifest the organization’s strengths and weaknesses that interact with the external environment
The analysis of threats and opportunities refer to the external dimension of the SWOT analysis. These interact with the internal strengths and weaknesses which relate to the internal dimensions of the SWOT in the quadrants ‘O’ and ‘T’.
The strengths and weaknesses of an organisation can best be identified in the process. A common tool for this is a value chain analysis. It is possible to search strengths and weaknesses in other views of the organisation such as the organisation, infrastructure, leadership etc. But if these do not manifest in the process, they are not really relevant. Process performance represents what we are able to do (effectiveness) and how well we are able to do it (efficiency) and these aspects can be mapped to strategic goals. If a weakness or a strength does not manifest in the process, it does not impact the organisations performance. Taking a process view on strengths and weaknesses is a useful perspective to identify strengths and weaknesses that are relevant to the SWOT analysis.
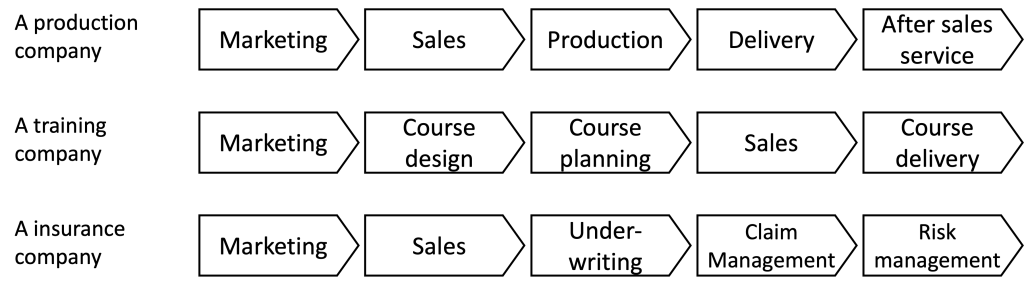
The configuration of the processes defines the strategic positioning and differentiation of an organisation
Porter (1985) suggests that the strategic position of an organisation depends on the configuration of its activities (i.e. its processes). Looking at the diagram above, we can see that the processes are naturally distinctive between different industries. The art of strategic positioning, is to configure processes so that they are distinct within the industry and they therefore differentiate the organisation from competitors. This avoids doing more of the same and competing on price.
For example with the advent of budget airlines, Ryan Air did away with expensive customer loyalty programs and catering services and changed the processes at the boarding gates to radically reduce airplane turn-around times. This provided a distinct offering that was appreciated by many consumers. Premium airlines have not been able to replicate this position as all processes need to be configured cohesively towards this way of working to be effective, from the recruiting of the board crew to longer-lasting snacks against extra pay.
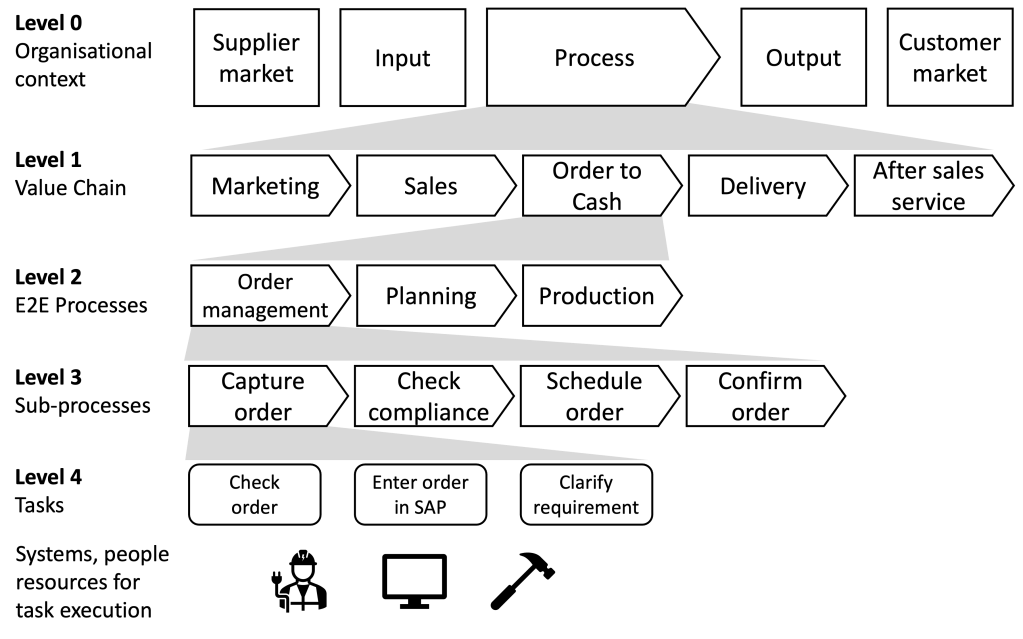
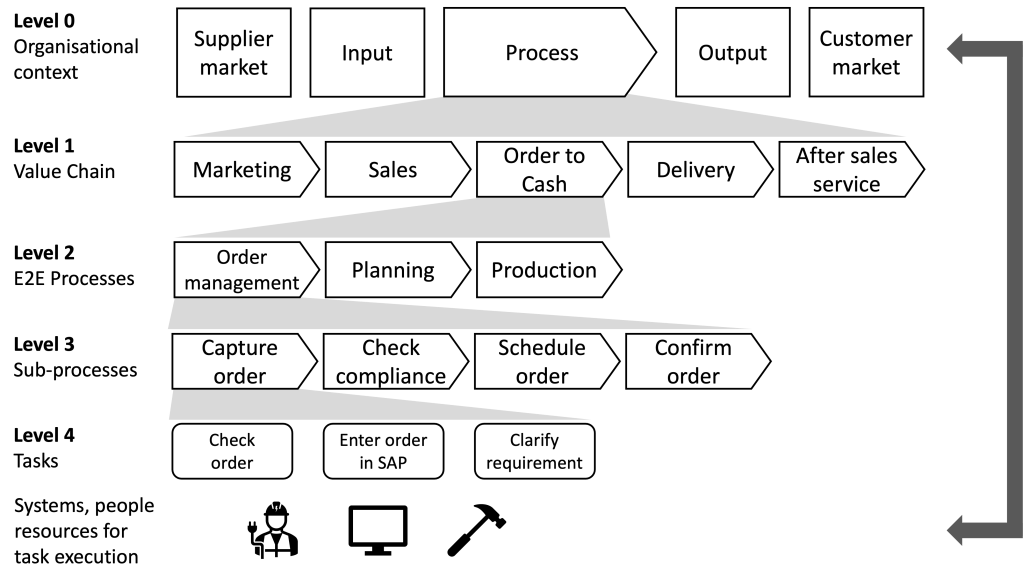
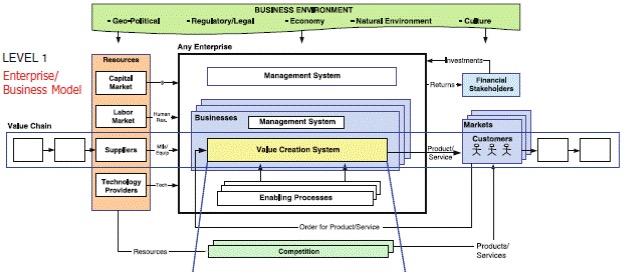
Processes can be viewed as a hierarchy
There are different ways of defining hierarchical layers for the view on an organisation’s processes, and this is one example. Level 0 is the organisation in the context of the near and far external environment. Level 1 is the value chain of the organisation. Level 1 can be extended to include activities of more than one organisation if customers and suppliers collaborate to strengthen the overall value chain. Level 0 and Level 1 are the levels of strategy analysis and formulation with each process in the value chain being assigned to strategic goals.
Level 2 is the individual end-to-end process. An end-to-end process starts with an external customer demand (e.g. a new tool), ends with the fulfillment of that demand (the tool is delivered, installed and operational) and fully processes the related object (e.g. customer order). Level 2 processes need to be managed and improved holistically.
Level 3 is a way of breaking down and end-to-end process to get a better overview. In some cases it is convenient to add levels if the end-to-end process is long or complex.
Level 4 is the task-level where the process hits the road. Users and machines perform the actual work using systems, tools and other resources. Additional levels could be added for sub-tasks, data structures etc.
The process view links strategy, organization, systems, resources
There is a significant distance between the strategic levels 0 and 1 and level 4 where the work is done. This gap may be visible in the organisational culture whether senior management does its gemba walks and interacts with workers or recedes to office desks and board rooms. The process view helps visualise, discuss and manage the link between strategy, performance, tasks, people and resources.
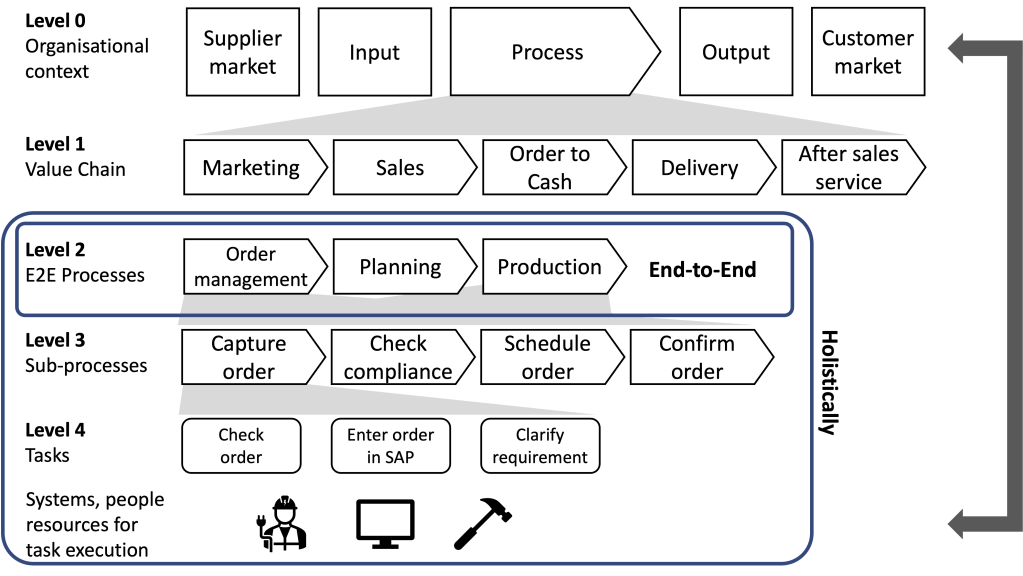
Processes must be improved holistically and end-to-end
Level 0 and 1 are about strategy analysis and formulation, i.e. about doing the right thing.
Level 2 is about strategy implementation and operational improvement, i.e. doing it right. Proven improvement methodologies such as lean or six-sigma tend to focus on level 3 and 4, as this is where people can continuously improve the way they work. This is not wrong, but carries the risk that a measurable and impressive improvement is an improvement within a task or a sub-process, but does not contribute to or even hinders overall value creation.
The dimension for assessing and prioritising process improvements should be the end-to-end process. An end-to-end process
starts with the need of an external stakeholder and ends with the fulfillment of that need
Completes the processing of an object such as a customer order, a purchasing order or a job vacancy
Runs across functions
Has a process owner
A holistic view of the process includes not just the tasks but the people how execute the tasks, the tools and systems they use, safety and ethical considerations etc. A process improvements therefore needs to include the motivation and enablement of people, leadership, management of resources etc. to be sustainable.
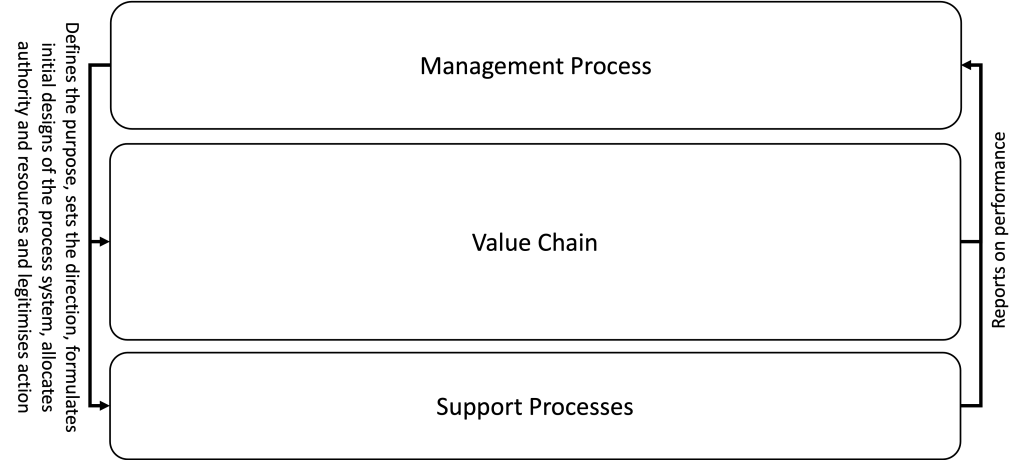
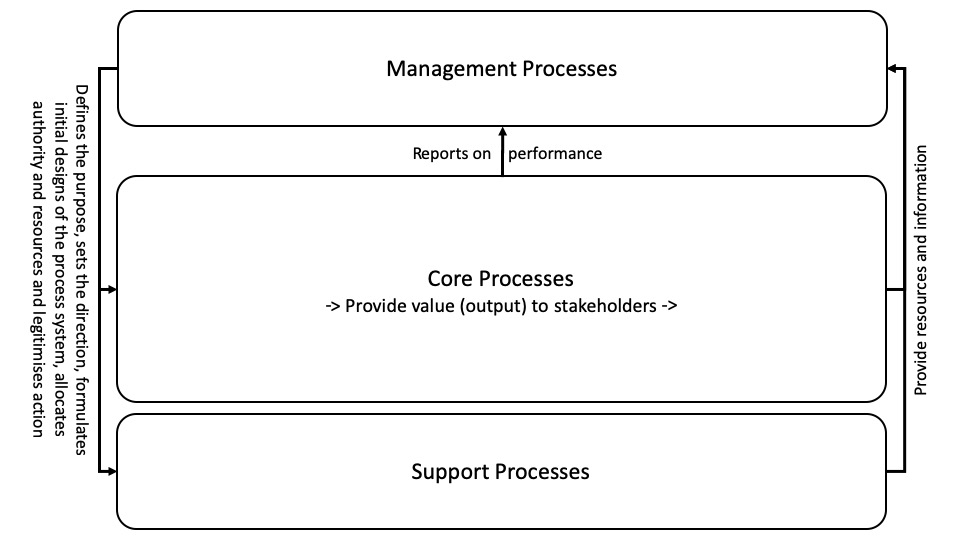
The management process design and manage the value chain- The support processes provide resources to the value chain
The focus so far has been on the value chain of the organisation. This does not run independently, but needs resources and needs to be managed.
The management process defines the strategic purpose and initial design of the value chain and allocates authority and resources. The design of the management process is discussed in this blog-post.
Support processes provide the resources (e.g. qualified personnel, infrastructure, IT-Systems) and information (e.g. controlling) required to run and manage the value chain.
Final Thoughts
As mentioned in the introduction, these elaborations are neither complete nor detailed, but hopefully there are points that help to position BPM as a as a management discipline that actively involves all levels of the organisation from strategy formulation over strategy implementation all the way to daily task execution and continuous improvement. BPM can provide the view, the thinking and the methodology needed to achieve this degree of alignment between intent and action.
Process strategy is about putting your business strategy into action. It is the answer to the question which processes your business should operate and how it should configure these processes as an overall system to effectively take on its strategic position and execute on the formulated strategy. Your process strategy is a process view of your operations strategy.
What is Process Strategy?
Your process strategy should provide clarity on the following aspects:
Which core and support processes should the company run and how should these work together as a system
What is the degree of effectiveness versus efficiency of each process and how will this be measured
The intended level of process maturity of each process
The degree of automation (none, rule driven, AI)
Use of off-the-shelf versus custom IT systems
Prioritisation and type of investment in tangible and intangible resources (assets and potentials)
The deliverables that code your process strategy include the following (I will elaborate on the individual deliverables in future blog-posts):
Deliverable
Description
Process map
Shows your core and support processes augmented with information on e.g. competences, IT system strategy, automation.
Process-relationship diagram
Shows how your the output of each process contributes to subsequent processes and together constitute a value system
Customer-interaction diagram
Visualises the customer experience by showing your core processes interact with customer processes – particularly useful for service or customer-experience focused organisations and usually based on a Kano-analysis
Process-objective matrix
Details the KPIs and objectives in the ‘Process’ dimension of your strategy map or BSC
Resource & Potentials Objectives
Detail the KPIs and objectives in the ‘Potentials’ dimension of your strategy map or BSC
ImplementationProgramm
The projects and investments required to transition from the as-is to the to-be state
Deliverables that code your process strategy
As with all strategic analysis there is a time-dimension of where the organisation is now and where it intends to be in future, so it will be useful to have either separate versions of the deliverables comparing the current and the future intended state or a single version indicating both views.
How-To Design Your Process Strategy
Process strategy formulation builds on your business strategy. Typical deliverables of a business strategy formulation are, for example, a STEEPL analysis, an industry analysis, identification of key success factors, internal resource analysis, a SWOT and so on. The approach proposed here builds on a review of such artefacts to deduct the implications for your process strategy. If you do not have these ready, some preparation would be worthwhile.
In this post we will deduct our process strategy from our business strategy. But be aware that this is a two-way street as the capabilities you have or are able to build may well inform your business strategy.
The Process
The basic steps to design your process strategy are listed here. I will add some diagrams to visualise the key deliverables at a later stage:
Process Map
Review your STEEPL analysis to understand any constraints which processes you can run, must run, how you can run them, which you can outsource etc.
Review your vision and mission statements, your strategic position and focus and the critical success factors to identify which core and support processes you need to run
Review your SWOT analysis and your core, distinctive and dynamic competences to identify which process drive these and give these a visual ‘competence marker‘
Don’t finalise the process map yet, this will be refined during the rest of the process
Customer-interaction diagram
This step is relevant for service or customer-focussed organisations (for organisations focussing on operational or product excellence this is optional and can be done at a later stage)
Map your customer’s processes
Map your processes that interact directly with the customer against the customer processes and define the input-output relationships
Review or run a KANO analysis to identify which interactions you need to excel on and add a visual ‘customer performance marker’ on those processes
Process-relationship diagram
Map out the input-output relationships between the core processes you have identified
Build a system of processes that clearly reflect your strategic position, strengthen your competences and is difficult to imitate – this is the most difficult step in the process and needs some deep thinking and clear trade-offs to create a unique and sustainable position for your organisation
Benchmark your process map and process relationship map against your competitors or an industry standard – if you are too similiar, then you do not have a unique position and will end up competing on price – in this case go back to the previous point and drive for a unique position
Mark processes that drive your unique position with a ‘position marker‘
Check your ‘competence markers‘ whether they help drive your position and revise if needed
Refine and finalise your process map based on the insights you have gained
Define your digitisation and IT strategy for each process and add a ‘digitisation marker‘ (i.e. manual, standard ERP, custom, AI …)
Define the level of process maturity you want to achieve for each process and add a ‘maturity marker‘ (e.g. from 1 to 5)
Process-objective matrix
List your strategic objectives
Add objectives related to competences, customer interactions, position and process output
Create a matrix that maps the processes to the objectives
Add the objectives regarding output and customer interactions to the ‘process’ dimension of your balanced scorecard (BSC)
Objectives for resources and potentials
Define which tangible (assets, machinery, infrastructure etc.) and intangible (knowledge, skills, networks, brand etc.) you require to drive your processes efficiently and effectively
Where these assets are provided by a support process add these to the process-objective matrix
Where a project is required to provide the resource submit a project charter
Implementation programme
Where objectives can be attained by incremental changes within the resources of the line organisation, assign objectives to teams and departments
For larger changes create a programme to be submitted to the PMO
Interpreting Your Business Strategy Deliverables
How well this process runs will depend on the quality of your business strategy formulation and the depth of your analysis. If this is done as a mechanical exercise that you get done with so you can get back to real work, the chances are high that your strategy will not address the real strategic issues and does not give you a competitive advantage.
Much has been written elsewhere on effective strategy formulation, here I give some simple guidance to the analysis of your business strategy:
Area of assessment
Examples and comments
STEEPL
Authorities may regulate the design and execution of certain processes for compliance or safety reasons. The EU prescribes how customs process run or which sanctions checks need to be done for exports. In Brazil invoices must be validated before goods receipt and imports must be outsourced to approved brokers.
Critical success factors
Superior customer service, competitive cost or automated production are examples of critical success factors that are driven by processes and need to be addressed in the process design. Location of facilities would not be process related.
Strategic goals and priorities
If the strategic priority is market growth then processes related to marketing and customer relationships will carry high importance. If the strategy is technology leadership then innovation and R&D will carry more importance.
Strategic focus
According to Treacy and Wiersema (1992) companies need to suffice in all of the following areas but should focus on excelling in one of them: Customer intimacy, product or operational excellence. If the focus is on customer intimacy then customer relationship and experience processes will need to be designed comprehensively. This primarily relates to core processes that flow directly to the customer and not necessarily to support processes which can focus on efficiency. In case of a product focus the value chain will focus on production related processes.
Degree of vertical and horizontal integration
Textile merchants designing and producing their own label would be an example of vertical integration. This can influence the scope to be considered for BPM. If the textile merchant acquires or partners with another company in the same segment of the value chain this would be horizontal integration. This will require a choice to what degree the processes should be standardized.
Product strategy focus on service or product
Services are delivered as processes which need to be designed as interaction between the provider and the customer. In case of products, the production processes are usually executed without customer interaction, but products are always augmented by services such as sales, delivery, design or maintenance.
Analyse stakeholders for implications on process
Strategic stakeholders such NGOs or local vicinity may influence process design such as the need to reduce noise or purchase from local suppliers.
Process Strategy Implementation
The focus of this blog-post is process strategy formulation and we take a closer look at implementation when we talk more about the role of Project Management Office and the strategic positioning of continuous improvement.
For now the a quick summary:
Larger changes needed to realise your process strategy are submitted as projects and tracked within the PMO structure (examples are process re-engineering, infrastructure investments or a major organisational change).
Progressive changes are managed by setting objectives for daily operations and implemented via continuous improvement measures.
Logically, for this to work, your organisation will need to have a working PMO structure and continuous improvement systems setup, as well as a clear distinction of what is a project and what is a continuous improvement measure.
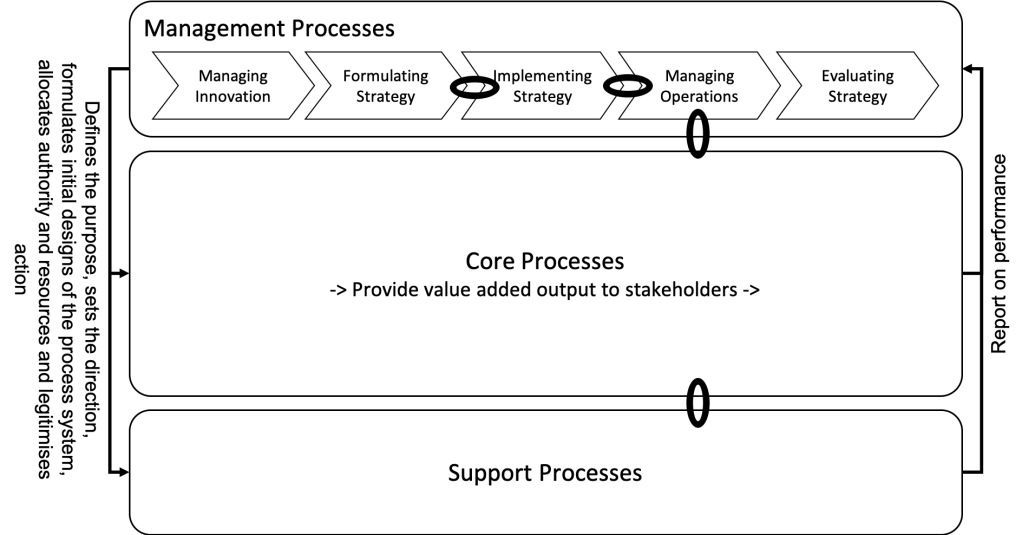
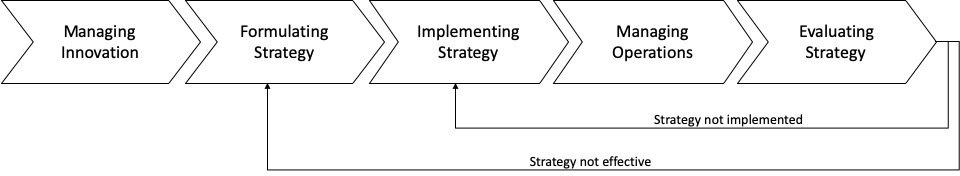
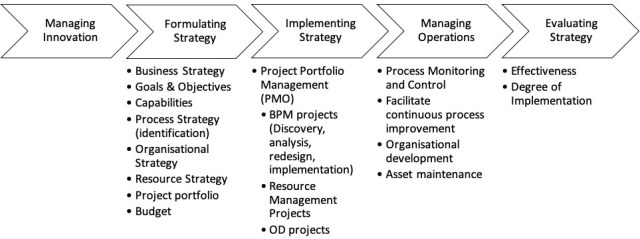
In the blogpost “Integrating the Management Process” we brought strategic and process management into a single management system under the accountability of senior leadership. The intent is have a cohesive system where strategy formulation clearly links to strategy implementation and to the management of operations. Here is a simple visualisation from that blog post:
Level 1 Management Process
The flow from left to right with one part of the management process feeding into the next throws a deceptively simplified view on the cohesion of the system. Fact is, that this is not the case: Despite establishing a singular accountability of top management for the management system, without implementing additional mechanisms cohesion will break down because there are a different set of people working on each part of the management process and, more importantly, on the core processes that are being managed by the management process. These people have different views on the organisation, different competences and education, different networks and different value sets.
Weak Links
This creates multiple weak links in the chain from vision and mission to action and results. These links can be visualised in several ways. Here we take a hierarchical view on the process, indicating how objectives and action is as far away from the initial vision as the CEO from the shop-floor worker after objectives have been cascaded down the hierarchy:
Hierarchy of Objectives (Bredrup, H., 1995) and involved levels of the organisation
Similarly, the vision and mission that have been carefully devised in many costly executive meetings, are steadily filtered as they pass hands along the management process chain. The effect of the filter is magnified by the varying temporal cycles of each part of the chain: How well are the critical aspects of the vision that is revisited every few years, still a key focus area of department and team leads when managing operations on a daily basis?
The management process as a filter across hierarchies and time
But the weakest link between vision and action is between the management process and the core and support processes. This is the link between managing operations and executing operations and this is where people act based on the immediate constraints and pressures of daily operations. And these pressures and constraints compete very effectively with the a vision that was communicated a couple of years earlier.
Weak links from strategy formulation to operational action
The nature of the links between management and core or support processes that we need to establish, if we want to lead an organisation according to a defined strategy, are described on the left and right of the illustration. The question is how can we strengthen these links?
Take the Lead
We all know the importance of communication and we can be creative how we make the management process matter to everyone: This could be staff input and involvement, road-shows, breakfast meetings with senior management, strategy quizzes at the annual new year’s dinner and many more. And there is an obvious need to ensure a robust design of the management process with defined interfaces, leadership involvement and iterations between the sub-processes.
This is all helpful and a considerable effort here will be necessary, but this is not sufficient. Such approaches could be devised by a clever internee. But the focus of this blog post is on the essential aspect of leadership in bridging the link between the management process and operational execution in the core processes and make sure that formulated strategy guides daily action.
The idea for this blog was initially inspired by several observations of leadership in action:
At a 3-D printing start up with 45 employees the CTO would take a weekly walk through the company asking staff to explain their process KPIs and the levers to improve those KPIs
A production manager would spend about a quarter of his day observing part of the process to check if staff stuck to the process standards
In the maintenance organisation of a European airline the CEO had a T-Card system to organise his shop-floor visits to ensure each area was regularly and systematically covered
Every company with a solid lean management culture will have a system of Gemba-Walks where management regularly takes a look at the real-life process and checks compliance with 5S principles and standard process definitions
What is common about these observations is the personal, insistent and repetitive leadership of those running the processes by a manager who has a clear idea of what is important for performance. These managers did not hide behind the vision statement on the intranet, job descriptions, annual staff objectives or other standard management techniques they had learned at business school. They took a direct leadership role to coach, enable and require staff to act according to the intended strategy and objectives.
This is why I have titled this blog post with the term ‘leadership routines’ and not ‘management routines’. Of course the term leadership touches a multitude of variables (Winston and Patterson, 2006) and there are as many definitions. But for the sake of practicality I refer to a useful working definition “Leadership is a process of social influence, which maximizes the efforts of others, towards the achievement of a goal” (Kruse, 2013).
So we are not talking about management tasks such as allocation of resources, formulating objectives or approving a budgets. These are all important, but they do directly inform shop-floor behaviour. To bridge the gap between the management process and operational execution in the core processes, we the kind of impactful guidance that can compete with the immediate operational constraints and pressures, with existing team attitudes and values. A guidance that puts the strategic goals at the center of action.
Leadership Routines
Further up I mentioned that leadership needs to be direct, insistent and repetitive. Repetitive means that leadership needs to happen on an ongoing routine basis and must not get displaced by administrative management tasks. There is no point having the qualities of a leader if the organisation never gets to see those qualities in action.
Therefore the second word in the term ‘leadership routine’ is an important one. The first word ‘leadership, is addressed in this blog by applying practice proven methods to that routine. Aspects like building charisma and communication skills is beyond the scope of this blog.
Here I describe five leadership routines that you can choose from, combine, extend and adapt when devising your own approach to bringing strategic focus to the shop and office floor. Which approach fits best will depend on your context, the level or process maturity and your own leadership style.
Management by Walking Around
Gemba Walk
Objective checks
KATA
Attend performance dialogs
Each of these approaches would deserve their own blog post or a chapter of a book. The objective of this blog post is to establish the need to bring leadership to the shop and office floor if the management process is to impact action and results and provide an entry into proven methods. Below I summarise some of these methods and provide links and references so you can delve deeper as needed.
Management by Walking Around
Management by walking around (often abbreviated as MBWA) may be the earliest approach to systematically leading by personal interaction between management and staff. MBWA was practiced at Hewlett-Packard in the 1970s and popularised by Tom Peters and Robert Waterman in the 1980s (Serrat, 2017).
MBWA focuses on building an informal and constructive two-way exchange between staff and management and shifting the role of the manager from one of command and control to that of a coach. Whilst this does give space for management to coach staff and ‘transmit the organisation’s values’, a large part of the effort is more foundational around building a more informal culture that empowers staff to bring in ideas and drive performance.
Serrat suggests the following steps to implement MBWA:
Wander about as often as you can, but recurrently and preferably daily.
Relax as you make your rounds.
Share and invite good news.
Talk about family, hobbies, vacations, and sports.
Watch and listen without judgment.
Invite ideas and opinions to improve operations, products, services, etc.
Be responsive to problems and concerns.
Look out for staff doing something right, and give them public recognition.
Project the image of a coach and mentor, not that an inspector.
Give staff on-the-spot help.
Use the opportunity to transmit the organization’s values.
Swap value and legacy stories.
Share your dreams.
Have fun.
Gemba Walk
The well established principle of lean thinking is that you can only understand and solve issues at the place they occur. This need to be on the shop-floor is coded in the lean method Gemba Walk. Whilst retaining the cultural force of staff empowerment practiced in MBWA, the Gemba Walk adds a strong and structured process view by involving management in viewing the whole value stream and identifying waste.
This can be structured in seven steps (kanabize.com):
Pick a theme
Prepare your team
Focus on the process
Be where the value stream is
Record your observations – don’t make suggestions during the walk
Add an extra pair of eyes
Follow-up with multiple stakeholder views
When implementing Gemba Walks it is recommended to use a lean coach for around 6 months to establish good practice. A Gemba Walk check-list helps maintain a transparent and repeatable structure.
Objective checks
Objective checks ensure that each member of staff knows their processes, the process objectives and the levers to reach those objectives. It is important to first establish a culture of staff empowerment and the role of manager as a coach so that this does not turn into an exam situation. But there should also be no hesitancy to expect staff to understand their contribution to organisational performance. This approach helps instil basic process thinking in the organisation. A pre-requisite is that those processes are defined and agreed.
The approach is simple: The manager coach visits staff members during their work activities and asks them questions such as:
Who are the customers of your process?
What are their needs?
What is the process output that serves those needs?
How is the process measured and what are the objectives?
What can you do to help reach those objectives?
KATA
Whilst the objective check ensures a solid understanding of process performance, KATA takes the next step and coaches staff to act on that understanding. KATA is a coaching technique to build a culture of rigorous continuous improvement. KATA builds on an understanding of the target state of the process, the current state and the definition of the next step towards the target state.
There are 5 coaching questions that go with these method:
What is the target state of the process or process step you are improving?
What is the current state?
Which obstacles are stopping you reaching the target state and which single obstacle will you tackle next? What exactly is the problem?
What is therefore the next step you will take and what is the expected outcome?
When can we meet to check what you have learned from step 4?
The approach needs to be data-driven to be effective and this requires some training and coaching. Also the ability to make and evaluate the outcome of multiple small experiments in step 4 needs training.
KATA has many parallels to the lean A3 sheet approach. Both are structured problem solving methods that follow the PDCA cycle. The A3 method is more suited to small projects done in a team and led by a staff member trained on the method. KATA is something that all staff members can be practicing within their own work area.
Coaching KATA effectively takes some learning and the website of Tilo Schwarz is a huge resource for this: https://www.tiloschwarz.com/
Attend performance dialogs
Performance dialogs are where process teams get together to identify and track measures to achieve their process objectives. Attending these is a quick way for a manager to understand where a team is and how they are progressing towards their targets.
This cannot replace a visit to the shop or office floor where the process is actually performed, but can be a complementary routine to see if and how observations made during visits to the office and shop floor are addressed by the team.
Managers attending performance dialogs should make sure they do not take over and override the moderator in any way. The best way to ensure this is to stick to questions rather than statements – this avoids giving directives.
Questions can be simply to understand objectives or a measure better or can be taken from the ‘objective check’ or ‘KATA’ method.
Final Thoughts: Management Commitment in Action
Managing commitment is the most frequently quoted success factor for complex projects and organisational change. This is very much valid for establishing continuous process improvement which requires not only a method but also a way of thinking and a value system.
But the nature of management commitment is seldom defined. Agreement, for example, is not commitment. I have experienced managers who would agree with a project but not free up the time of the key project team members or provide funding for external hires.
But providing resources, a management task, is also not sufficient.
I was once working with a managing director who was extremely supportive of projects to introduce BPM and lean management. Resources were provided without question, a war room was set up, staff was pulled out of key areas and senior managers were given objectives for their contribution to project success. These were all strong and helpful points, but they were not fully convincing as the MD was not visibly prioritising his own time and effort in the same way and it proved difficult to get the required time from the next management level. The project significantly picked-up after we agreed on time the MD needs to spend leadership activities. To make sure this was reliably done, we visualised the agreed daily and weekly activities in a T-Card system showing exactly what had been completed and what not. We had established a routine.
Management commitment is demonstrated by taking leadership. The leadership routines described in this blog were initially developed by managers who saw the need to lead their organisation, not just manage it. In the same way you will need to establish the leadership routines that work best for you and your organisation. This will require some deep thinking, reflection and creativity. The routines defined in this blog are examples and should help to get started. I have not provided a single cohesive template because there is not one-size-fits-all approach – this will need to be your task.
References
Bredrup H. (1995) The Traditional Planning Hierarchy. In: Rolstadås A. (eds) Performance Management. Springer, Dordrecht. https://doi.org/10.1007/978-94-011-1212-3_5 retrieved on 11.10.20 11:40
The process jour fixe is a periodic structured meeting with the extended process team with the purpose of maintaining and developing the standard process, whereby the standard process is a moving target.
Purpose
The objective of the process jour fixe is not primarily to improve processes, rather it is a governance platform to ensure that the current process and future process changes are understood and agreed by all key process stakeholders and coded in the organisation’s formal process documentation. This is a key management task to ensure that the live process, the agreed process and the documented process are the same – only when this synchronicity is established do we have a coherent standard process.
The process jour fixe provides a platform to reconcile current and intended practice against the multitude of forces that drive process change. These forces of process change can be triggers of improved business process performance such as legitimate new customer needs, technological advancements, improved expertise or insights from benchmarking or improvement initiatives. Such changes should be systematically incorporated into the process standard. Or they can be forces of arbitrary change that work against an effective standard such as individual personal work-arounds in the IT system, ad-hoc improvisation to manage new customer needs, illegitimate customer needs that do not add value to the end-to-end value chain, additional work to accomodate for poor process interfaces and many more. The process jour fixe provides a platform to identify and eliminate these.
Of course there are many methods to define and develop a standard process be it lean management, performance dialog, continuous improvement, internal or external audits or the definition of process governance roles. But amidst these forces of change the process jour fix provides a short moment to reconcile and get everyone on the same page and to together document that page. Without a conscious effort to regularly bring everyone on board with the agreed standard, the forces of change will create multiple islands of diverse process practice that are impossible to manage and improve systematically.
Participants – The Extended Process Team
The process jour fixe requires a diverse set of participants to ensure all stakeholder views and the required expertise is present in the room. The simultaneous availability of all views gives the process jour fix its power and the ability make immediate and final agreements based on a full set of expertise. This group of people is what I call the extended process team. This could include the following roles (remember a person can act in multiple roles) – this is a broad set of people, but having everyone on board ensures that agreements hold:
Role
Contribution
Process Manager
initiates the meeting and makes final decisions
Moderator
structures and leads through the meeting ensuring that the input from all participants is well considered, ensures that changes are documented and agreed or defined as follow-up tasks
Process Modeler
visualises process changes as a basis for discussion and agreement
Process coach
guides the team to incorporate process thinking, lean principles and best practices into the process design
Representatives from adjacent customer processes
provide insights into the nature of the required process output
End-To-End process manager
explain the process purpose and decide on process interface questions, ensure the end-to-end process design is optimised
QM department member
contribute compliance and audit-related input
IT solution architect
ensure optimal utilisation of the existing standard software
Key users
evaluate the current process against their own understanding and the input from other members of the extended proces team and agree on the current process or propose a to-be process design
Users
provide input on the actual live process and pain points and contribute to to-be process design
Consultant
provide an outside view and additional process expertise that none else in the company has (this will be an optional and less frequent role)
Roles of the extended process team
Frequency
There should be a process jour fixe for each process at least once a year. That works for processes where the standard is well established. If a process has recently been implemented or if there have been many recent changes then the frequency can be temporarily increased to every 3-6 months.
If the extended process team can agree on and document all changes within the jour fixe, then you are on track.
Workshop Approach
Depending on the scope of the process and the maturity of the current standard you will normally need to schedule between 2 hours and a day for a process jour fixe.
The procedure is simple – it is basically about enabling an open and constructive discussion based on a common view of the process. The common view of the process is the as-is documentation – having a good quality version of this is a prerequisite to running a process jour fixe.
Based on the as-is process documentation you can follow these steps:
Welcome the team and recap the purpose and agenda of the meeting
Present the process scope and purpose
Summarise change forces related to the process
Walk through the documented as-is process step-by-step in detail
For administrative or IT-based processes ideally show the process documentation on one screen and walk-through the execution on a second screen; for shop-floor processes do a physical walk through
for each step validate whether the documented as-is process represents actual practice or if there is improvement potential
If there is improvement potential or a need for change then open the discussion how the process should be
Ensure that all view-points of the extended process team are included and duly considered – this is key to the effectiveness of the meeting
Visualise the to-be process to provide a common basis for the discussion
Code agreed changes in the formal process documentation for subsequent formal submission
For larger changes that need further research, define follow-up tasks
Define how the process changes will be implemented
Define how follow-up tasks will be monitored (the process manager is accountable for this)
Set the (rough) time of the next process jour fixe
In summary, the primary outputs of the workshop are
a final process documentation that is ready for submission for publication based on
a common understanding and agreement and
a list of follow-up tasks (if any)
A secondary but essential output is the expertise and the insights that the participants have gained during the workshop discussions. This could be the input from an IT solution architect on how to better utilise the system, a reminder on a compliance issue by the QM manager or, most importantly, deeper insights into the needs of the process customer and the process purpose.
Final Thoughts
As with all techniques the effectiveness of the process jour fix will depend on how well it is executed and on how well it complements other techniques as part of an overall methodology.
Running the process jour fix effectively is primarily a matter of having the right people in the room and enabling an open but structured discussion and capturing and agreeing on the outcomes.
Making the process jour fix an effective element of an overall methodology is about identifying the outputs of each method or technique and designing these to constitute a coherent system. The process jour fixe is a useful platform to ensure outputs from methods that trigger process change are systematically coded in the process standard.
The list of tools related to this blog is documented in a google spreadsheet which is embedded below. On a mobile device it may be more convenient to open the actual spreadsheet using this link.
The tools are listed in the structure of the integrated management process. This is a ‘living’ document that will continue to develop for some time to come. Due to the integrative nature of BPM, the toolbox is not limited to BPM tools, but covers the whole management process. But when detailing selected tools in separate blog posts, the focus will be on BPM.
In the columns of the spreadsheet, possible tool selections are shown as examples for specific project contexts – these for illustration only and you should adapt this to your own needs. The selection and sequence of the tools will constitute the work breakdown structure of your project.
Performance dialogs bring the discourse around objectives and KPIs to the teams that actually impact those objectives and KPIs in their day-to-day work. Talking about performance will, in most cases, be a cultural change, but can be a powerful foundation for continuous improvement and to align team efforts to organisational goals.
Making Performance Matter
The art of measuring performance is well advanced. Systems for business intelligence, process mining, digitalization and artificial intelligence can be used to gather large data sets and produce a myriad of KPIs at the push of a button. With strategy maps and balanced scorecards these can be aligned to give a meaningful picture of past and potential performance at different levels of the organisation.
But the best designed KPIs have no value if they do not trigger action for improvement. Dashboards that are available but not accessed and reports that are filed have no impact on performance and are administrative waste.
The maintenance Organisation of a European airline spent two years to develop a web-based dashboard to visualize KPIs such as costs, dispatch reliability, and fleet availability – KPIs that should matter to everyone. Go-live was a proud and highly anticipated moment communicated with full management backing. But even repeat communications could not get the usage statistics off the ground – the dashboard was largely ignored by the organisation.
In order to trigger action, KPIs need to matter to those who run the processes that impact those KPIs. They need to be part of the organizational discourse and something that matters to the employees. These are the conversations where people get creative and collaboratively find ways to work better.
Enter the performance dialog: When the same airline implemented performance dialogs, KPIs became the talk of the day. Each team had a white board displaying the KPIs that the team is accountable for. The boards were always in sight and the teams would regularly get together to discuss current performance against goals and trigger improvement measures where needed.
Objectives and KPIs were cascaded down the hierachy to make sure everyone was aligned to the organisational goals. The web-based dashboard became both the central source of the KPIs as well as a tool for detailed research into causes if performance was under target.
But the journey was not an easy one with lenghty discussions around relevance and meaning of KPIs and resistance against the new found transparency on how well a team is performing. This post summarises the key points to consider when establishing a dialog around performance that triggers real improvements.
Implementation Phases
Identify teams
Formulate the team’s mission
Set objectives & KPIs
Visualise the KPIs
Setup the board
Start the dialog
Drive improvement & support the dialog
If you already implemented business process management in your organisation with a solid methodology, this should already cover at least the first three phases.
Identify Teams
Identifying the teams that should implement the performance dialog and in which sequence is a question of scoping and prioritisation. There is no need to do everything at once – if performance dialogs are new to your organisation there will be a learning curve and running the implementation in phases and starting with a pilot will reduce the risk of project issues being multiplied across all teams. One option is to start with the most promising teams first – those teams that are most motivated and capable, will overcome difficulties and act as lighthouses and coaches for the teams that follow. Or you could start top down with the management team first to lead by example and cascade down a single branch of the organisation to illustrate how teams can align vertically. But also consider which teams are dependent on each other’s output and should align horizontally and possibly attend each others performance dialogs.
A core question is whether your performance dialogs a structured by organisational unit or by process. An organisation that wants to reap the benefits of process orientation and manage performance end-to-end across functions, will need to build cross-functional teams and accountabilities.
Formulate the Team’s Mission
Terms such as ‘vision’ and ‘mission’ are usually used to frame the high-level purpose of a whole organisation. But every team has a purpose and making this explicit in a clear statement will support the discussions and workshops you will need to align intended purposes vertically from top to bottom and horizontally along the end-to-end process.
The mission statements should be as brief as possible, ideally a single sentence. This forces the team to be specific and focus on the main reason why the process or function exists. The question needs to be, what is the core contribution to the organisation’s performance. At this point it is more about supporting a discussion to achieve a common understanding than about granular details. The simplest form of mission statement for a process team is a description of the process output.
Mission statements need to be aligned and approved by the next level up the hierarchy as well as by the internal customers along the end-to-end process chain. This ensures that the whole organisation is driven by a cohesive system of purposes that reinforce each other and serve the overall organisational goals. The hierarchical alignment can be documented similarly to an org chart. A useful tool to capture this more systemically and to visualise the horizontal alignment is a process relationship map (a deliverable you should already have available if you have process management in place).
Set the Objectives & KPIs
Objectives should translate your mission or purpose into a more specific and measurable definition that guides your team to set the right priorities and do the right thing in their day-to-day work so that they make a targeted contribution to organisational performance.
Measure Your Mission
The team’s mission statement is the first piece of input you will need when it comes to setting objectives, but it can be tricky to make your core purpose measurable in a meaningful way. If, as an example, the mission of the purchasing department is to ensure the availability of services and materials needed to run the business, then you will need to define and measure objectives around availability. One way to measure this would be the time from receipt of a material request to material availability. With stocked material this can be practically zero, but with non-stocked material this will vary between materials making it tricky to get an agreed definition of good performance. But shortening lead times may not be the best lever to improve availability – for some materials you may be able to identify demand early by using sensors to measure degree of depletion or via predictive analytics.
Whilst the mission or purpose can be more directional, it will take some intense thinking and broad discussion and alignment to pack this into meaningful objectives.
Manage Conflicting Objectives
A simple approach to achieve high availability of materials, to stick to the example above, would be to put large quantities on stock. But stock is costly and keeping stock-levels low should also be an objective. An effective way of reconciling this kind of conflict between objectives is to put them under a single accountability. This may require adjusting the mission statement to include such trade-offs e.g. ‘Ensure availability of services materials whilst keeping inventory low’.
If you need to keep conflicting objectives under separate accountabilities you will need to reconcile this at level higher in the hierarchy to avoid managers optimising the KPIs at the cost of others. If you have process management in place and can set your objectives at each level of a well designed process map, then this integration will be implicit in the end-to-end processes.
System of Objectives
Measuring your mission is the first step to selecting the objectives that drive the right behaviour. But this may overlook objectives that are not core to your purpose but important to manage – for example cost, safety or performance enablers such as staff competencies and motivation. A good way to structure a broader discussion around these objectives are frameworks such as SQCDP, the balanced scorecard (BSC), the Dupont KPI tree or the 4 ‘E’s. These frameworks have different origins but can work well together.
SQCDP has its origins in lean visual shop-floor management in the production area and includes dimensions such as safety and costs but, due to its focus on production, omits aspects like sales volume, revenue or profit.
BSC was developed by Kaplan and Norton (1992) in the early nineties and measures both enablers that drive future performance (Potentials, Process) and historical results (Customer, Finance).
The Dupont KPI tree is a hierarchy of financial measures and drivers that fit into the finance and process dimensions of the BSC. As these KPIs are mathematically connected you can use the tree to identify levers of improvement that will ultimately impact financial performance. As an example, improving your accounts receivables process to get timely payments from customers will reduce your current assets. This will in turn increase your asset turnover and therefore your ROI (which is calculated from asset turnover and return on sales). Ultimately this will impact ROCE (which is calculated from ROI and WACC). To an accounts receivables clerk it can be an elevating insight that his or her work has a direct impact on the organisation’s financial performance and a top-level management KPI.
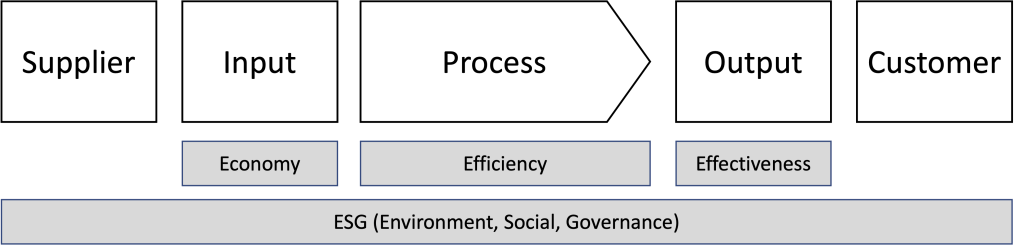
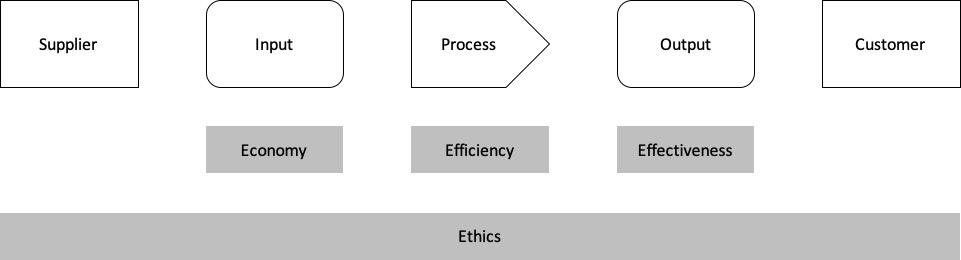
A useful framework to get a holistic view of the process dimension of the BSC is the ‘4 Es’. The ‘E’s stand for Economy, Efficiency, Effectiveness and Ethics. In the diagram below these KPI categories are mapped to a SIPOC diagram to visualise their meaning.
The 4 Es mapped to a SIPOC diagram
‘Economy’ measures input and is largely the area of procurement. ‘Effectiveness’ measures output and represents the core purpose of most processes. ‘Efficiency’ is a combination of economy and effectiveness and is calculated as output / input (i.e. producing a large amount of output with little input such as sales per square meter, pieces produced per minute or lead to prospect conversion ratio).
Each of the above frameworks would deserve its own post (and may get one in future), but this brief introduction should suffice to illustrate in the following table how they can be combined to get a complete and cohesive view on your system of objectives and KPIs:
SQCDP
BSC
Dupont KPI tree
4 ‘E’s
Safety
Quality
Process
E.g. inventories
Economy Efficiency Effectiveness
Cost
Finance (but includes profit)
E.g. ROI, ATO, RSO, Working Capital
Delivery
Customer
E.g. Sales
People
Potentials (part of)
Ethics
The KPI Frameworks Combined
None of these frameworks are complete which is why you should not draw on a single one. But each has its strengths that are worth building on. And there are other frameworks out there, such as EFQM, that you could add. You can use the input from the table above to construct the KPI dimensions that best work for your own organisation. The discussions around this topic can be intense but will generate useful insights into how you want to view performance. And agreeing on common categories throughout the organisation will establish a common language which will aid collaboration vertically and across teams.
Select the KPIs that Guide Your Team to do the Right Thing
With the framework above it is easy to can come up with dozens if not hundreds of KPIs. And these may well be very relevant to managing organisational performance and fit well in a corporate BI dashboard. But for performance dialogs we need the KPIs that are relevant to managing a team. These will be a subset of the KPIs and should fulfill the following criteria:
The selected KPIs must clearly guide the team to do the right thing
The team must be able to influence the KPI
There must be no more than 5 objectives
The KPIs Must Clearly Guide the Team to do the Right Thing
It is not always easy to clearly measure the intended performance. A common fallacy is to base your objectives on what is easy to measure rather than what really reflects your mission. When an Austrian software company outsourced its second level support to India, they defined response time as a key KPI. An evaluation after half a year of operations, showed that response times were excellent, but that customer satisfaction had detiorated drastically based on a series of complaints. In order to reach and beat the required response time, the employees of the Indian partner had developed an approach to respond to incidents with requests for more information on the issue or on the system setup rather than doing upfront research. This was frustrating to clients who were used to support specialists exploring incidents before getting back to them with more constructive feedback. Following the evaluation customer satisfaction was added as the primary objective, but a better design before outsourcing would have avoided a series of annoyed customers.
A common example is to measure the success of sales based on turnover rather than profitability. If your purpose is to win market share, this may make sense, but if you are working in a saturated market segment this would encourage the wrong behaviour.
Finding the KPIs that drive the right behaviour will need some rigorous thinking to avoid guiding people in the wrong direction.
Select KPIs that the Team can Influence
There is clearly little sense in assigning a KPI to a team if the team cannot impact that KPI. Nevertheless this happens all to often in practice: Making the logistics manager responsible for on-time delivery though production planning confirms the delivery date; Making the inventory manager responsible to decrease inventory levels though the purchasing department replenishes stock; Making sales responsible for customer satisfaction though this is impacted by product quality and service level. The trick is to identify which team really drives the KPI and make that team own the KPI. If you already have process management in place with process related KPIs this will be a much easier exercise.
In some cases multiple teams will impact a KPI. For example on-time delivery may be impacted by production planning, production and logistics. From a customer perspective you need to measure and improve the overall performance. But to guide your teams it will be worth the effort to measure the specific contribution of each team and set specific objectives. This will avoid many discussions and blame games when it comes to improving the KPI. If that is not possible you will need to assign the KPI that has the most interest in its improvement and empower this team accordingly. A good example is quality: there are many causes for quality issues but quality needs to be managed as a single topic. That is the purpose of the quality department. The quality department cannot increase quality itself, but can analyse the root causes issues and must be empowered to trigger and monitor improvement measures and projects.
Select Maximum Five KPIs
As mentioned further up it is easy to come up with dozens of KPIs that all seem important. But if we want to use KPIs to guide a team’s actions, then it is impossible to focus on a complex system of KPIs – you need to select maximum five, better one to three. You may have a complex BI dashboard for a full view and detailed analysis, but this will not provide the clear focus you need to incite action and encourage creative discussion. And you may also have additional KPIs on your performance dialog board that you want to monitor with the team in case they go wrong, but that you do not use to actively drive improvement.
The focused selection of one to five refers to those KPIs that you want your team to actively improve. Some of these may be temporary, for example you may want the team to bring throughput time to an acceptable level over the coming six months and then move to something else. Other KPIs may be permanent because they relate to the core mission of the team or to a distinctive competence.
Do you Define the Objective or the KPI first?
When I first came across performance dialogs the suggested process was to first define objectives and then define the KPIs to measure those objectives. My suggestion is to always define objectives and KPIs together as a single entity: To make an objective specific and measureable (as in SMART) you will always need a KPI. To make a KPI meaningful you will always need a target level and a time by when that level should be reached. In this post I use KPI and objectives as synonyms.
Create KPI Descriptions
The concept of SMART objectives is well established. As mentioned above, to be truly specific an object will need a defined KPI. A useful way to define a SMART objective is a KPI description that includes the following points:
Name
Description
Importance
Levers for improvement
Unit of measurement
Formula for calculation
Data source (system, table, fields)
System for presentation
Frequency of measurement (e.g. continuously, daily, monthly …)
Current value
Agreed and realistic (but stretch) target value
Time by which target value needs to be reached
KPI owner (accountable to improve the KPI reach the target)
KPI Team (resonponsible to improve the KPI and reach the target)
Responsible person to report the KPI
Dependent KPIs
Comments
The KPI descriptions can be kept handy near the performance dialog board as a reference to clarify the exact meaning of the KPI if needed. When you get to this level of detail you will find that the available data and the logic of the IT systems will influence what exactly you measure. This is often a trade-off between what you want to measure and what is feasible to measure. When making that trade-off make sure that the KPI guides the right action. And in some cases, if there are no numbers in the system, you may need to gather these manually.
Handling Qualitative Objectives
Some objectives cannot be easily quantified but you may still want to manage them. For such aspects you can develop alternative approaches. An example is employee motivation: A possible approach is to visualise a line from ‘frustrated’ to ‘highly motivated’ and let employees place a magnet on the continuum reflecting where the are at the moment. The resulting picture serves more as a prompt for discussion than a hard measure. An extension of the continuum is to have a matrix with motivation as one dimension and how busy or stressed the employee is another. In this case too busy combined with frustrated indicates an issue to be discussed as does not busy and frustrated – but each case may prompt a different discussion.
Visualise the KPIs
KPIs need to presented in a way that they guide the team to trigger the right improvements. A glance at the KPI should tell you if you are on target or if action needs to be taken. For this you need to visualise current performance against the performance target. Simple visualisations like traffic lights or other symbols can summarise where action is needed and where not. If current performance is far from what it should be, it you can stagger the improvement over time to guide an incremental improvement process. If, for example, production throughput time needs to be reduced by 50% within the next ten months, you could translate this into 5% per month. How you visualise a KPI may also be constrained by the BI tool you are using.
Establish Reporting Structures (Standards, Roles and Responsibilities)
Defining objectives and KPIs is one thing, the other is to find an efficient way to make the measures available for the performance dialog board. People need to be assigned to this task and given the right tools that enable a high degree of automation.
An element of central coordination such as a reporting team, maybe under the controlling deparment, will help maintain a transparent system of reports or a central dashboard and build a good level of expertise. But this will need to be balanced against the need to quickly generate reports on the fly for KPIs that will be tracked only temporarily or to research issues identified during the performance dialog in more detail. A useful approach is to have BI key users in the departments that work with the tools and standards defined by the central reporting team.
Setup the Board
A google search on ‘SQCDP board‘ will give you some useful examples of what a board can look like. Go for a layout that gives a good overview of KPIs and the measures you generate to improve those KPI. One way of thinking of this is that if you return after a long vacation, a glance on the board should give you a good idea of how the team is doing and which issues they are currently tackling. Involving your team in the board setup will help get a better understanding and improve acceptance.
Elements you can include on the board layout are:
Title (‘Performance Dialog’, ‘Shopfloor Board’ or whatever terms suits you…)
Department
Board owner: Person accountable for the performance dialog
Moderator: Person who will moderate the next performance dialog
Time of next meeting or re-ocurring time
Team mission
The team’s processes
Critical issues that need immediate attention (e.g. machine breakage or high level of seek leave)
Visualised KPIs in the structure you have designed in your ‘system of objectives’
Improvement measures for each KPI
Performance dialog process (e.g. KPIs from left to right, review ongoing improvement measures, current performance, trigger new improvement measures, trigger follow-up discussions to be prepared for next dialog…)
Issues to escalate to next level in the hierarchy or to an adjacent team
Issues brought in from other teams
Things that went specially well
Game rules (mandatory attendance, no mobile devices or other distractions, no-blame culture)
Feedback and improvement suggestions to the performance dialog
In addition to the improvement measures that you trigger and track within the team (or in collaboration with adjacent teams) you could dedicate a section of the board to track projects related to the teams objectives. In project oriented organisations this may occupy the large part of the board.
Having a common or similiar layout across the organisation will enable collaboration and learning, but it may make sense to have two or three versions to cater for differing needs of e.g. shop floor and administrative areas.
A manual board on a magnetic whiteboard is more interactive and flexible than a digital dashboard. Place the board in an area that is easily accessible.
Start the Dialog
More will follow on this, to start with a few bullet points to consider:
Make sure the objectives and KPIs are understood and agreed as far as possible before you use them actively in the performance dialog
Have a coach for the first sessions and now and then to improve how you run the dialog
The frequency of the performance dialog should reflect the rate at which the performance situation measurably changes (on the shop-floor this may be daily, whilst in sales this develops over time).
Have a fixed re-ocurring time to hold your performance dialog and stick to it
Stick to a fixed duration of 10-30 minutes – assign more detailed follow-up discussions and improvement implementation to people or teams outside the performance dialogEnsure an open and collaborative discussion and a no-blame culture
Consider rotating the moderation of the performance dialog
The moderator should prepare the board, make sure the current KPIs are posted and identify focus points before the dialog
If teams lower down the hiearchy are held earlier in the week, the results can be reflected in high-level boards held afterwards.
Drive Improvement & Support the Dialog
The value of the performance dialog is to generate measures of improvement. It is essential to implement these improvements to reap that value and make the performance dialog an effective part of your management system.
You will need to establish governance over which improvements teams can implement without approval using their own resource and which improvements should be submitted and approved as a project through your PMO, maybe based on cost or complexity. The progress and impacts of these measures and projects should be tracked as part of the performance dialog to ensure control and overall transparency.
If continuous improvement is to be sustainable, it needs to be intrinsically motivated and ingrained in the organisational culture. So be careful with extrinsic rewards, especially financial ones – personal recognition and leading by example will serve as a more solid basis.
It is tempting to skip performance dialogs due to operational priorities – first individual sessions, then several and then the dialog dies out. Team leaders need to give strong priority to performance dialogs to keep the improvement going and management should treat the performance dialog as a key element of the management system. An open culture in which managers visit performance dialogs in the hierarchy levels below them and team members can visit adjacent or higher-level performance dialogs will add a strong dynamic to the dialog.
Final Considerations
Performance dialogs can be a powerful management tool to rally the teams in your organisation behind common objectives across processes and hierarchies and to drive targeted continuous improvement. Though performance dialogs can be led as singular initiatives of individual departments, the real strength lies in broad and integrated roll-out across the organisation. This is when management gains the transparency and control it needs to align performance to strategic priorities.
But no management tool stands alone: You will only be able to align your objectives if you have a clear and robust organisational vision, mission and strategy to follow. Your objectives can only be horizontally integrated end-to-end if you have a well designed process map. Identifying the right improvement measures is the first step – you also need an effective method to analysing and implementing them. And though most team members will be motivated to contribute to team performance, this should be backed by performance management on an individual level.
Management processes are, all too often, designed as an afterthought, with much more time invested in the development of the core processes that deliver customer value. The resulting management process is often a list of concepts or management topics rather than a purposeful and interconnected system of activities.
In a previous post I argue that managing business processes should be an integral part of the organisation’s management process (and not a separate lifecycle) and therefore a top-level management responsibility. Following the understanding that a process is not just a sequence, but a system of activities, we are essentially talking about a management system. For that reason I will treat the terms ‘management process’ and ‘management system’ as synonyms.
This post proposes a framework for a management process (or system) that includes business process management (BPM) as an integral component whilst taking a holistic view by combining BPM with the adjacent disciplines organisational development and asset management.
The External Environment
Geary Rummler (2006) with his consulting company Performance Design Labs, set the processes of an organisation in the context of the near and far external environment. Though this is not the topic for now, it is included here for the sake of completeness to indicate that the management process operates within a larger context that needs to be duely considered. This will be discussed in later posts.
Looking now at the internal environment of the organisation, this is commonly visualised as a process map with three categories of processes: Management processes, core processes, support processes (differing from but synonymous to Rummler’s wording above).
Level 1 Process Categories and their Relationships
I have added relationships between each process category. This is adapted from the formal systems model (Fortune, 1993) which is a generalizable model of a system capable of purposeful activity without failure. For the purpose of this post, these relationships should help specify what the management processes (or management system) needs to provide: Purpose, direction, initial design of the process system, allocation of authority and resources and legitimisation of action. This is no small feat especially if this is to be delivered in a format that can be understood and acted on by those running the core processes.
Management Processes
Now let’s take a look inside the proposed management process – first on a high level:
Level 1 Management Process
The focus of the top-level management system is clearly on strategy. This strategy will be informed by innovation potentials. We will ignore innovation for now in order to limit the scope of this post (not because innovation is not important – it may be vital and it may relate to process innovation). Strategy is formulated, then implemented and then executed on in operations. As any healthy system needs control, the strategy is evaluated whether it is properly implemented and whether it has been effective. Let’s now take a look at the second level content of these processes:
Level 2 Management Processes
The business strategy will translate into strategic goals and objectives that will require organisational capabilities to achieve. Building and maintaining these capabilities is a combined effort of the process, organisational and resource strategies – therefore these must not just be aligned to the business strategy but also to each other. And of course this is not a waterfall process but a highly iterative one. The implementation of these strategies is packaged into a project portfolio and budgeted accordingly. Resource strategy in this case refers to all tangible and intangible resources required to run the processes and the organisation – a broad interpretation that pertains to the resource based view of the organisation.
Strategy implementation is managed by the PMO in way of projects and programs. Using established methods of project and project portfolio management provides a high degree of transparency and control to strategy implementation and is therefore a key vehicle to establishing effective governance. This approach requires a PMO structure that is geared to strategic management and C-Level management involvement. Listing BPM, resource management and organisational development projects separately is misleading here, as most projects will be cross-disciplinary as visualised in the following picture.
An integrated management approach (BPM Business Process Management, OD Organisational Development, RM Resource Management)
Note that in brackets in the level 2 processes I have listed typical BPM lifecycle elements as identified in my post on ‘The Problem with the BPM Lifecycle‘ – these are integrated here into a holistic management process (and not treated as a seperate BPM lifecycle that attempts to manage processes in isolation). Under the management process ‘Managing Operations’ I have added the bullet ‘Facilitate continuous process improvement’. This relates to the proposal made in the above mentioned post to add an element to the BPM lifecycle for day-to-day improvements that do not trigger another cycle through process discovery. The actual improvement work is run in the operational teams, the job of management is to facilitate this by providing direction, motivating and enabling staff and legitimising time spent on continuous improvement activities.
Implications for Top Management
Following this kind of management process that combines several management disciplines requires C-Level managers with sufficient insights into these methodologies. It is no longer possible to delegate organisational development to the HR department and BPM to the quality department as disconnected initiatives. That does not mean that C-Level managers need to be top-class project, process or change managers. But they do need to connect and guide these disciplines and to take on the accountability for the results. They need to collaboratively, in a cross-disciplinary team, translate strategy into a project portfolio and to select and approve those projects that will impact strategy and performance most and stop those that do not deliver the required value. They will need to take a holistic view of strategy implementation and operations and facilitate combined continuous improvement of processes, organisation and resources.
Putting the Management Process into Action – A Contingency Approach
An organisation’s process, OD or resource management journey may start at different points for different reasons. It may be the next SAP technology jump that dictates the definition of a complete process template. It could be market price pressure that requires bringing in a high level of operational excellence to bring down costs. Or a production manager may want to address a bottle neck in a specific work area. Or employees may be annoyed with repetitive hick-ups in a process and the unnecessary rework involved. Very few organisations are willing or able to implement a full-blown management process that integrates multiple management disciplines in a big bang – and there may be no benefit in doing so (but possibly a lot of risk).
This is where the contingency approach comes in – the ability to adapt the approach to the specific context. This does not play well with consultants who like to apply a one size fits all methodology, but it caters for the fact that each case is different and will benefit from a customised approach.
A toolset approach as in the sub-title of this blog seems contrary to a contingency approach. This is where I use a trick from the IPMA project management standard: A check-list of project management deliverables is used to select which deliverables should be produced depending on the nature and complexity of the project. The benefit is that you apply proven methods, but only those that are effective for the case at hand. A similar check-list is under development for BPM and management deliverables – but more on this in subsequent blogs.
References
White, D., Fortune, J., (2009). The project-specific Formal System Model. International Journal of Managing Projects in Business, 2(1) pp. 36–52.
This post attempts to make sense of an issue that has repeatedly troubled me when implementing business process management at organisations – the BPM lifecycle.
The business process lifecycle comes in various shapes and sizes depending on the researcher or consultant you refer to. Malinova et.al. (2014) studied various lifecycles and packed the core ideas into the second box of the framework below:
A small but important caveat here is that the framework assumes ‘process analysis’ always follows ‘process discovery’ (which comprises as-is documentation, setting performance goals etc.). There is little place in this cycle for day-to-day continuous improvement of processes where employees change the layout of the work area to reduce movement, learn a new function in the IT system or apply 5S to save time spent on searching tools. These are the multitude of small improvements that are (or should be) done continuously in small incremental steps to maintain an appropriate level of operational excellence. These kind of measures should be a key part of any BPM lifecycle but do not need a re-assessment of the process model or redefinition of goals that are part of ‘process discovery’.
A simple fix would be to draw a line from the step ‘process monitoring and controlling’ to ‘process analysis’, so that you can jump straight to the analysis of the root cause if the process underperforms. But this would not reflect the fact that continuous improvement applies different methods and steps than the proposed lifecycle. The BPM lifecycle above is more aligned to process reengineering than to the the PDCA cycle of continuous improvement. Though the two are closely related, they do apply different methods, governance and mindsets. I would therefore propose to extend the process lifecycle to enable a distinct and more specific view on continuous improvement. In the model above this is rather hidden as ‘undertake minor corrective action’ within the ‘Process Monitoring & Control’ step. Giving continuous improvement more visibility would require linking the ‘Process Monitoring & Control’ step to both ‘Process Discovery’ (to trigger process reengineering type projects) and a separate PDCA or DMAIC cycle (to trigger continuous improvement measures or projects).
I remember well my visit to the HQ of an international airline group. On the second floor there were to separate corridors – one for business process management and one for lean management. The physical separation reflected the way of working. Whilst business process management was part of TQM and more concerned with documenting processes for audits and compliance, the lean department was concerned with the continuous improvement of process performance following the PDCA process. But, despite their distinct operation, both entities were ultimately meant to ensure efficiency and effectiveness of processes. There was no collaboration between the two until a year after my visit a major and costly initiative was started to bring all process management related activities under a single organisation. A major question still open at the time was when to start a process identification exercise and when to continuously improve the identified and implemented processes.
BPM does not Work in Isolation
A larger issue with the BPM lifecycle is that it looks stand alone – like an isolated discipline that you can delegate to your quality management department or to a newly hired process manager and be done with. But processes are executed to deliver the organisational purpose by people in departments using resources. It makes little sense to manage processes independently of these other aspects. Much of this is addressed by the ‘Initial BPM elements’ of the BPM implementation framework above. This is a valuable and welcome addition, but still limited: The question of resources other than human resources is missing. Every process requires some kind of resource and resources usually carry a cost and are always scarce. Deploying resources where they have the greatest impact on strategy and performance and making the right trade-offs are key management decisions. The concept of managing processes independently from the management of resources is a risky simplification.
The details of the 4 initial BPM elements as listed in the original article, whilst useful and comprehensive, are limited to a process perspective. Taking the example of the element ‘Governance’ the detail ‘process management decision making’ makes the impression that you can make decisions on processes in isolation: Of course, if you implement BPM you need to ensure governance over decisions relating to processes, but as processes are always connected to purpose, organisation and resources, these need to be holistic management decisions.
Conclusions
My critique does not target the BPM implementation framework as such – this is impressively well thought through if you are looking to a full blown implementation of BPM. My point is that implementing BPM as a stand-alone discipline bears the risk of disconnected decisions by people with a limited perspective.
My proposal is to integrate the BPM lifecycle into a holistic management process and implement that management process. You can find a proposal for a holistic integrated management process in this blog post.
References
Malinova, M., Mendling, J., Hribar, B. (2014), A Framework for Assessing BPM Success in Twenty Second European Conference on Information Systems, Tel Aviv 2014.