Performance dialogs bring the discourse around objectives and KPIs to the teams that actually impact those objectives and KPIs in their day-to-day work. Talking about performance will, in most cases, be a cultural change, but can be a powerful foundation for continuous improvement and to align team efforts to organisational goals.
Making Performance Matter
The art of measuring performance is well advanced. Systems for business intelligence, process mining, digitalization and artificial intelligence can be used to gather large data sets and produce a myriad of KPIs at the push of a button. With strategy maps and balanced scorecards these can be aligned to give a meaningful picture of past and potential performance at different levels of the organisation.
But the best designed KPIs have no value if they do not trigger action for improvement. Dashboards that are available but not accessed and reports that are filed have no impact on performance and are administrative waste.
The maintenance Organisation of a European airline spent two years to develop a web-based dashboard to visualize KPIs such as costs, dispatch reliability, and fleet availability – KPIs that should matter to everyone. Go-live was a proud and highly anticipated moment communicated with full management backing. But even repeat communications could not get the usage statistics off the ground – the dashboard was largely ignored by the organisation.
In order to trigger action, KPIs need to matter to those who run the processes that impact those KPIs. They need to be part of the organizational discourse and something that matters to the employees. These are the conversations where people get creative and collaboratively find ways to work better.
Enter the performance dialog: When the same airline implemented performance dialogs, KPIs became the talk of the day. Each team had a white board displaying the KPIs that the team is accountable for. The boards were always in sight and the teams would regularly get together to discuss current performance against goals and trigger improvement measures where needed.
Objectives and KPIs were cascaded down the hierachy to make sure everyone was aligned to the organisational goals. The web-based dashboard became both the central source of the KPIs as well as a tool for detailed research into causes if performance was under target.
But the journey was not an easy one with lenghty discussions around relevance and meaning of KPIs and resistance against the new found transparency on how well a team is performing. This post summarises the key points to consider when establishing a dialog around performance that triggers real improvements.
Implementation Phases
- Identify teams
- Formulate the team’s mission
- Set objectives & KPIs
- Visualise the KPIs
- Setup the board
- Start the dialog
- Drive improvement & support the dialog
If you already implemented business process management in your organisation with a solid methodology, this should already cover at least the first three phases.
Identify Teams
Identifying the teams that should implement the performance dialog and in which sequence is a question of scoping and prioritisation. There is no need to do everything at once – if performance dialogs are new to your organisation there will be a learning curve and running the implementation in phases and starting with a pilot will reduce the risk of project issues being multiplied across all teams. One option is to start with the most promising teams first – those teams that are most motivated and capable, will overcome difficulties and act as lighthouses and coaches for the teams that follow. Or you could start top down with the management team first to lead by example and cascade down a single branch of the organisation to illustrate how teams can align vertically. But also consider which teams are dependent on each other’s output and should align horizontally and possibly attend each others performance dialogs.
A core question is whether your performance dialogs a structured by organisational unit or by process. An organisation that wants to reap the benefits of process orientation and manage performance end-to-end across functions, will need to build cross-functional teams and accountabilities.
Formulate the Team’s Mission
Terms such as ‘vision’ and ‘mission’ are usually used to frame the high-level purpose of a whole organisation. But every team has a purpose and making this explicit in a clear statement will support the discussions and workshops you will need to align intended purposes vertically from top to bottom and horizontally along the end-to-end process.
The mission statements should be as brief as possible, ideally a single sentence. This forces the team to be specific and focus on the main reason why the process or function exists. The question needs to be, what is the core contribution to the organisation’s performance. At this point it is more about supporting a discussion to achieve a common understanding than about granular details. The simplest form of mission statement for a process team is a description of the process output.
Mission statements need to be aligned and approved by the next level up the hierarchy as well as by the internal customers along the end-to-end process chain. This ensures that the whole organisation is driven by a cohesive system of purposes that reinforce each other and serve the overall organisational goals. The hierarchical alignment can be documented similarly to an org chart. A useful tool to capture this more systemically and to visualise the horizontal alignment is a process relationship map (a deliverable you should already have available if you have process management in place).
Set the Objectives & KPIs
Objectives should translate your mission or purpose into a more specific and measurable definition that guides your team to set the right priorities and do the right thing in their day-to-day work so that they make a targeted contribution to organisational performance.
Measure Your Mission
The team’s mission statement is the first piece of input you will need when it comes to setting objectives, but it can be tricky to make your core purpose measurable in a meaningful way. If, as an example, the mission of the purchasing department is to ensure the availability of services and materials needed to run the business, then you will need to define and measure objectives around availability. One way to measure this would be the time from receipt of a material request to material availability. With stocked material this can be practically zero, but with non-stocked material this will vary between materials making it tricky to get an agreed definition of good performance. But shortening lead times may not be the best lever to improve availability – for some materials you may be able to identify demand early by using sensors to measure degree of depletion or via predictive analytics.
Whilst the mission or purpose can be more directional, it will take some intense thinking and broad discussion and alignment to pack this into meaningful objectives.
Manage Conflicting Objectives
A simple approach to achieve high availability of materials, to stick to the example above, would be to put large quantities on stock. But stock is costly and keeping stock-levels low should also be an objective. An effective way of reconciling this kind of conflict between objectives is to put them under a single accountability. This may require adjusting the mission statement to include such trade-offs e.g. ‘Ensure availability of services materials whilst keeping inventory low’.
If you need to keep conflicting objectives under separate accountabilities you will need to reconcile this at level higher in the hierarchy to avoid managers optimising the KPIs at the cost of others. If you have process management in place and can set your objectives at each level of a well designed process map, then this integration will be implicit in the end-to-end processes.
System of Objectives
Measuring your mission is the first step to selecting the objectives that drive the right behaviour. But this may overlook objectives that are not core to your purpose but important to manage – for example cost, safety or performance enablers such as staff competencies and motivation. A good way to structure a broader discussion around these objectives are frameworks such as SQCDP, the balanced scorecard (BSC), the Dupont KPI tree or the 4 ‘E’s. These frameworks have different origins but can work well together.
SQCDP has its origins in lean visual shop-floor management in the production area and includes dimensions such as safety and costs but, due to its focus on production, omits aspects like sales volume, revenue or profit.
BSC was developed by Kaplan and Norton (1992) in the early nineties and measures both enablers that drive future performance (Potentials, Process) and historical results (Customer, Finance).
The Dupont KPI tree is a hierarchy of financial measures and drivers that fit into the finance and process dimensions of the BSC. As these KPIs are mathematically connected you can use the tree to identify levers of improvement that will ultimately impact financial performance. As an example, improving your accounts receivables process to get timely payments from customers will reduce your current assets. This will in turn increase your asset turnover and therefore your ROI (which is calculated from asset turnover and return on sales). Ultimately this will impact ROCE (which is calculated from ROI and WACC). To an accounts receivables clerk it can be an elevating insight that his or her work has a direct impact on the organisation’s financial performance and a top-level management KPI.
A useful framework to get a holistic view of the process dimension of the BSC is the ‘4 Es’. The ‘E’s stand for Economy, Efficiency, Effectiveness and Ethics. In the diagram below these KPI categories are mapped to a SIPOC diagram to visualise their meaning.
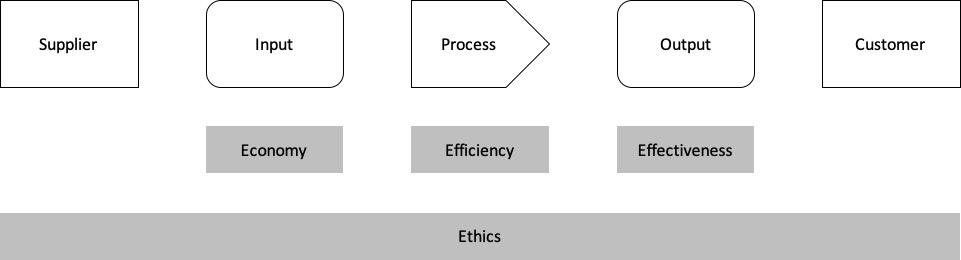
‘Economy’ measures input and is largely the area of procurement. ‘Effectiveness’ measures output and represents the core purpose of most processes. ‘Efficiency’ is a combination of economy and effectiveness and is calculated as output / input (i.e. producing a large amount of output with little input such as sales per square meter, pieces produced per minute or lead to prospect conversion ratio).
Each of the above frameworks would deserve its own post (and may get one in future), but this brief introduction should suffice to illustrate in the following table how they can be combined to get a complete and cohesive view on your system of objectives and KPIs:
| SQCDP | BSC | Dupont KPI tree | 4 ‘E’s |
| Safety | |||
| Quality | Process | E.g. inventories | Economy Efficiency Effectiveness |
| Cost | Finance (but includes profit) | E.g. ROI, ATO, RSO, Working Capital | |
| Delivery | Customer | E.g. Sales | |
| People | Potentials (part of) | ||
| Ethics |
None of these frameworks are complete which is why you should not draw on a single one. But each has its strengths that are worth building on. And there are other frameworks out there, such as EFQM, that you could add. You can use the input from the table above to construct the KPI dimensions that best work for your own organisation. The discussions around this topic can be intense but will generate useful insights into how you want to view performance. And agreeing on common categories throughout the organisation will establish a common language which will aid collaboration vertically and across teams.
Select the KPIs that Guide Your Team to do the Right Thing
With the framework above it is easy to can come up with dozens if not hundreds of KPIs. And these may well be very relevant to managing organisational performance and fit well in a corporate BI dashboard. But for performance dialogs we need the KPIs that are relevant to managing a team. These will be a subset of the KPIs and should fulfill the following criteria:
- The selected KPIs must clearly guide the team to do the right thing
- The team must be able to influence the KPI
- There must be no more than 5 objectives
The KPIs Must Clearly Guide the Team to do the Right Thing
It is not always easy to clearly measure the intended performance. A common fallacy is to base your objectives on what is easy to measure rather than what really reflects your mission. When an Austrian software company outsourced its second level support to India, they defined response time as a key KPI. An evaluation after half a year of operations, showed that response times were excellent, but that customer satisfaction had detiorated drastically based on a series of complaints. In order to reach and beat the required response time, the employees of the Indian partner had developed an approach to respond to incidents with requests for more information on the issue or on the system setup rather than doing upfront research. This was frustrating to clients who were used to support specialists exploring incidents before getting back to them with more constructive feedback. Following the evaluation customer satisfaction was added as the primary objective, but a better design before outsourcing would have avoided a series of annoyed customers.
A common example is to measure the success of sales based on turnover rather than profitability. If your purpose is to win market share, this may make sense, but if you are working in a saturated market segment this would encourage the wrong behaviour.
Finding the KPIs that drive the right behaviour will need some rigorous thinking to avoid guiding people in the wrong direction.
Select KPIs that the Team can Influence
There is clearly little sense in assigning a KPI to a team if the team cannot impact that KPI. Nevertheless this happens all to often in practice: Making the logistics manager responsible for on-time delivery though production planning confirms the delivery date; Making the inventory manager responsible to decrease inventory levels though the purchasing department replenishes stock; Making sales responsible for customer satisfaction though this is impacted by product quality and service level. The trick is to identify which team really drives the KPI and make that team own the KPI. If you already have process management in place with process related KPIs this will be a much easier exercise.
In some cases multiple teams will impact a KPI. For example on-time delivery may be impacted by production planning, production and logistics. From a customer perspective you need to measure and improve the overall performance. But to guide your teams it will be worth the effort to measure the specific contribution of each team and set specific objectives. This will avoid many discussions and blame games when it comes to improving the KPI. If that is not possible you will need to assign the KPI that has the most interest in its improvement and empower this team accordingly. A good example is quality: there are many causes for quality issues but quality needs to be managed as a single topic. That is the purpose of the quality department. The quality department cannot increase quality itself, but can analyse the root causes issues and must be empowered to trigger and monitor improvement measures and projects.
Select Maximum Five KPIs
As mentioned further up it is easy to come up with dozens of KPIs that all seem important. But if we want to use KPIs to guide a team’s actions, then it is impossible to focus on a complex system of KPIs – you need to select maximum five, better one to three. You may have a complex BI dashboard for a full view and detailed analysis, but this will not provide the clear focus you need to incite action and encourage creative discussion. And you may also have additional KPIs on your performance dialog board that you want to monitor with the team in case they go wrong, but that you do not use to actively drive improvement.
The focused selection of one to five refers to those KPIs that you want your team to actively improve. Some of these may be temporary, for example you may want the team to bring throughput time to an acceptable level over the coming six months and then move to something else. Other KPIs may be permanent because they relate to the core mission of the team or to a distinctive competence.
Do you Define the Objective or the KPI first?
When I first came across performance dialogs the suggested process was to first define objectives and then define the KPIs to measure those objectives. My suggestion is to always define objectives and KPIs together as a single entity: To make an objective specific and measureable (as in SMART) you will always need a KPI. To make a KPI meaningful you will always need a target level and a time by when that level should be reached. In this post I use KPI and objectives as synonyms.
Create KPI Descriptions
The concept of SMART objectives is well established. As mentioned above, to be truly specific an object will need a defined KPI. A useful way to define a SMART objective is a KPI description that includes the following points:
- Name
- Description
- Importance
- Levers for improvement
- Unit of measurement
- Formula for calculation
- Data source (system, table, fields)
- System for presentation
- Frequency of measurement (e.g. continuously, daily, monthly …)
- Current value
- Agreed and realistic (but stretch) target value
- Time by which target value needs to be reached
- KPI owner (accountable to improve the KPI reach the target)
- KPI Team (resonponsible to improve the KPI and reach the target)
- Responsible person to report the KPI
- Dependent KPIs
- Comments
The KPI descriptions can be kept handy near the performance dialog board as a reference to clarify the exact meaning of the KPI if needed. When you get to this level of detail you will find that the available data and the logic of the IT systems will influence what exactly you measure. This is often a trade-off between what you want to measure and what is feasible to measure. When making that trade-off make sure that the KPI guides the right action. And in some cases, if there are no numbers in the system, you may need to gather these manually.
Handling Qualitative Objectives
Some objectives cannot be easily quantified but you may still want to manage them. For such aspects you can develop alternative approaches. An example is employee motivation: A possible approach is to visualise a line from ‘frustrated’ to ‘highly motivated’ and let employees place a magnet on the continuum reflecting where the are at the moment. The resulting picture serves more as a prompt for discussion than a hard measure. An extension of the continuum is to have a matrix with motivation as one dimension and how busy or stressed the employee is another. In this case too busy combined with frustrated indicates an issue to be discussed as does not busy and frustrated – but each case may prompt a different discussion.
Visualise the KPIs
KPIs need to presented in a way that they guide the team to trigger the right improvements. A glance at the KPI should tell you if you are on target or if action needs to be taken. For this you need to visualise current performance against the performance target. Simple visualisations like traffic lights or other symbols can summarise where action is needed and where not. If current performance is far from what it should be, it you can stagger the improvement over time to guide an incremental improvement process. If, for example, production throughput time needs to be reduced by 50% within the next ten months, you could translate this into 5% per month. How you visualise a KPI may also be constrained by the BI tool you are using.
Establish Reporting Structures (Standards, Roles and Responsibilities)
Defining objectives and KPIs is one thing, the other is to find an efficient way to make the measures available for the performance dialog board. People need to be assigned to this task and given the right tools that enable a high degree of automation.
An element of central coordination such as a reporting team, maybe under the controlling deparment, will help maintain a transparent system of reports or a central dashboard and build a good level of expertise. But this will need to be balanced against the need to quickly generate reports on the fly for KPIs that will be tracked only temporarily or to research issues identified during the performance dialog in more detail. A useful approach is to have BI key users in the departments that work with the tools and standards defined by the central reporting team.
Setup the Board
A google search on ‘SQCDP board‘ will give you some useful examples of what a board can look like. Go for a layout that gives a good overview of KPIs and the measures you generate to improve those KPI. One way of thinking of this is that if you return after a long vacation, a glance on the board should give you a good idea of how the team is doing and which issues they are currently tackling. Involving your team in the board setup will help get a better understanding and improve acceptance.
Elements you can include on the board layout are:
- Title (‘Performance Dialog’, ‘Shopfloor Board’ or whatever terms suits you…)
- Department
- Board owner: Person accountable for the performance dialog
- Moderator: Person who will moderate the next performance dialog
- Time of next meeting or re-ocurring time
- Team mission
- The team’s processes
- Critical issues that need immediate attention (e.g. machine breakage or high level of seek leave)
- Visualised KPIs in the structure you have designed in your ‘system of objectives’
- Improvement measures for each KPI
- Performance dialog process (e.g. KPIs from left to right, review ongoing improvement measures, current performance, trigger new improvement measures, trigger follow-up discussions to be prepared for next dialog…)
- Issues to escalate to next level in the hierarchy or to an adjacent team
- Issues brought in from other teams
- Things that went specially well
- Game rules (mandatory attendance, no mobile devices or other distractions, no-blame culture)
- Feedback and improvement suggestions to the performance dialog
In addition to the improvement measures that you trigger and track within the team (or in collaboration with adjacent teams) you could dedicate a section of the board to track projects related to the teams objectives. In project oriented organisations this may occupy the large part of the board.
Having a common or similiar layout across the organisation will enable collaboration and learning, but it may make sense to have two or three versions to cater for differing needs of e.g. shop floor and administrative areas.
A manual board on a magnetic whiteboard is more interactive and flexible than a digital dashboard. Place the board in an area that is easily accessible.
Start the Dialog
More will follow on this, to start with a few bullet points to consider:
- Make sure the objectives and KPIs are understood and agreed as far as possible before you use them actively in the performance dialog
- Have a coach for the first sessions and now and then to improve how you run the dialog
- The frequency of the performance dialog should reflect the rate at which the performance situation measurably changes (on the shop-floor this may be daily, whilst in sales this develops over time).
- Have a fixed re-ocurring time to hold your performance dialog and stick to it
- Stick to a fixed duration of 10-30 minutes – assign more detailed follow-up discussions and improvement implementation to people or teams outside the performance dialogEnsure an open and collaborative discussion and a no-blame culture
- Consider rotating the moderation of the performance dialog
- The moderator should prepare the board, make sure the current KPIs are posted and identify focus points before the dialog
- If teams lower down the hiearchy are held earlier in the week, the results can be reflected in high-level boards held afterwards.
Drive Improvement & Support the Dialog
The value of the performance dialog is to generate measures of improvement. It is essential to implement these improvements to reap that value and make the performance dialog an effective part of your management system.
You will need to establish governance over which improvements teams can implement without approval using their own resource and which improvements should be submitted and approved as a project through your PMO, maybe based on cost or complexity. The progress and impacts of these measures and projects should be tracked as part of the performance dialog to ensure control and overall transparency.
If continuous improvement is to be sustainable, it needs to be intrinsically motivated and ingrained in the organisational culture. So be careful with extrinsic rewards, especially financial ones – personal recognition and leading by example will serve as a more solid basis.
It is tempting to skip performance dialogs due to operational priorities – first individual sessions, then several and then the dialog dies out. Team leaders need to give strong priority to performance dialogs to keep the improvement going and management should treat the performance dialog as a key element of the management system. An open culture in which managers visit performance dialogs in the hierarchy levels below them and team members can visit adjacent or higher-level performance dialogs will add a strong dynamic to the dialog.
Final Considerations
Performance dialogs can be a powerful management tool to rally the teams in your organisation behind common objectives across processes and hierarchies and to drive targeted continuous improvement. Though performance dialogs can be led as singular initiatives of individual departments, the real strength lies in broad and integrated roll-out across the organisation. This is when management gains the transparency and control it needs to align performance to strategic priorities.
But no management tool stands alone: You will only be able to align your objectives if you have a clear and robust organisational vision, mission and strategy to follow. Your objectives can only be horizontally integrated end-to-end if you have a well designed process map. Identifying the right improvement measures is the first step – you also need an effective method to analysing and implementing them. And though most team members will be motivated to contribute to team performance, this should be backed by performance management on an individual level.
References
Kaplan, S., Norton, D. (1992) The Balanced Scorecard—Measures that Drive Performance in Harvard Business Review, January–February 1992 Issue. Retrieved on 13.04.20 from https://hbr.org/1992/01/the-balanced-scorecard-measures-that-drive-performance-2

Leave a comment